Chapter 2
Basic imaging
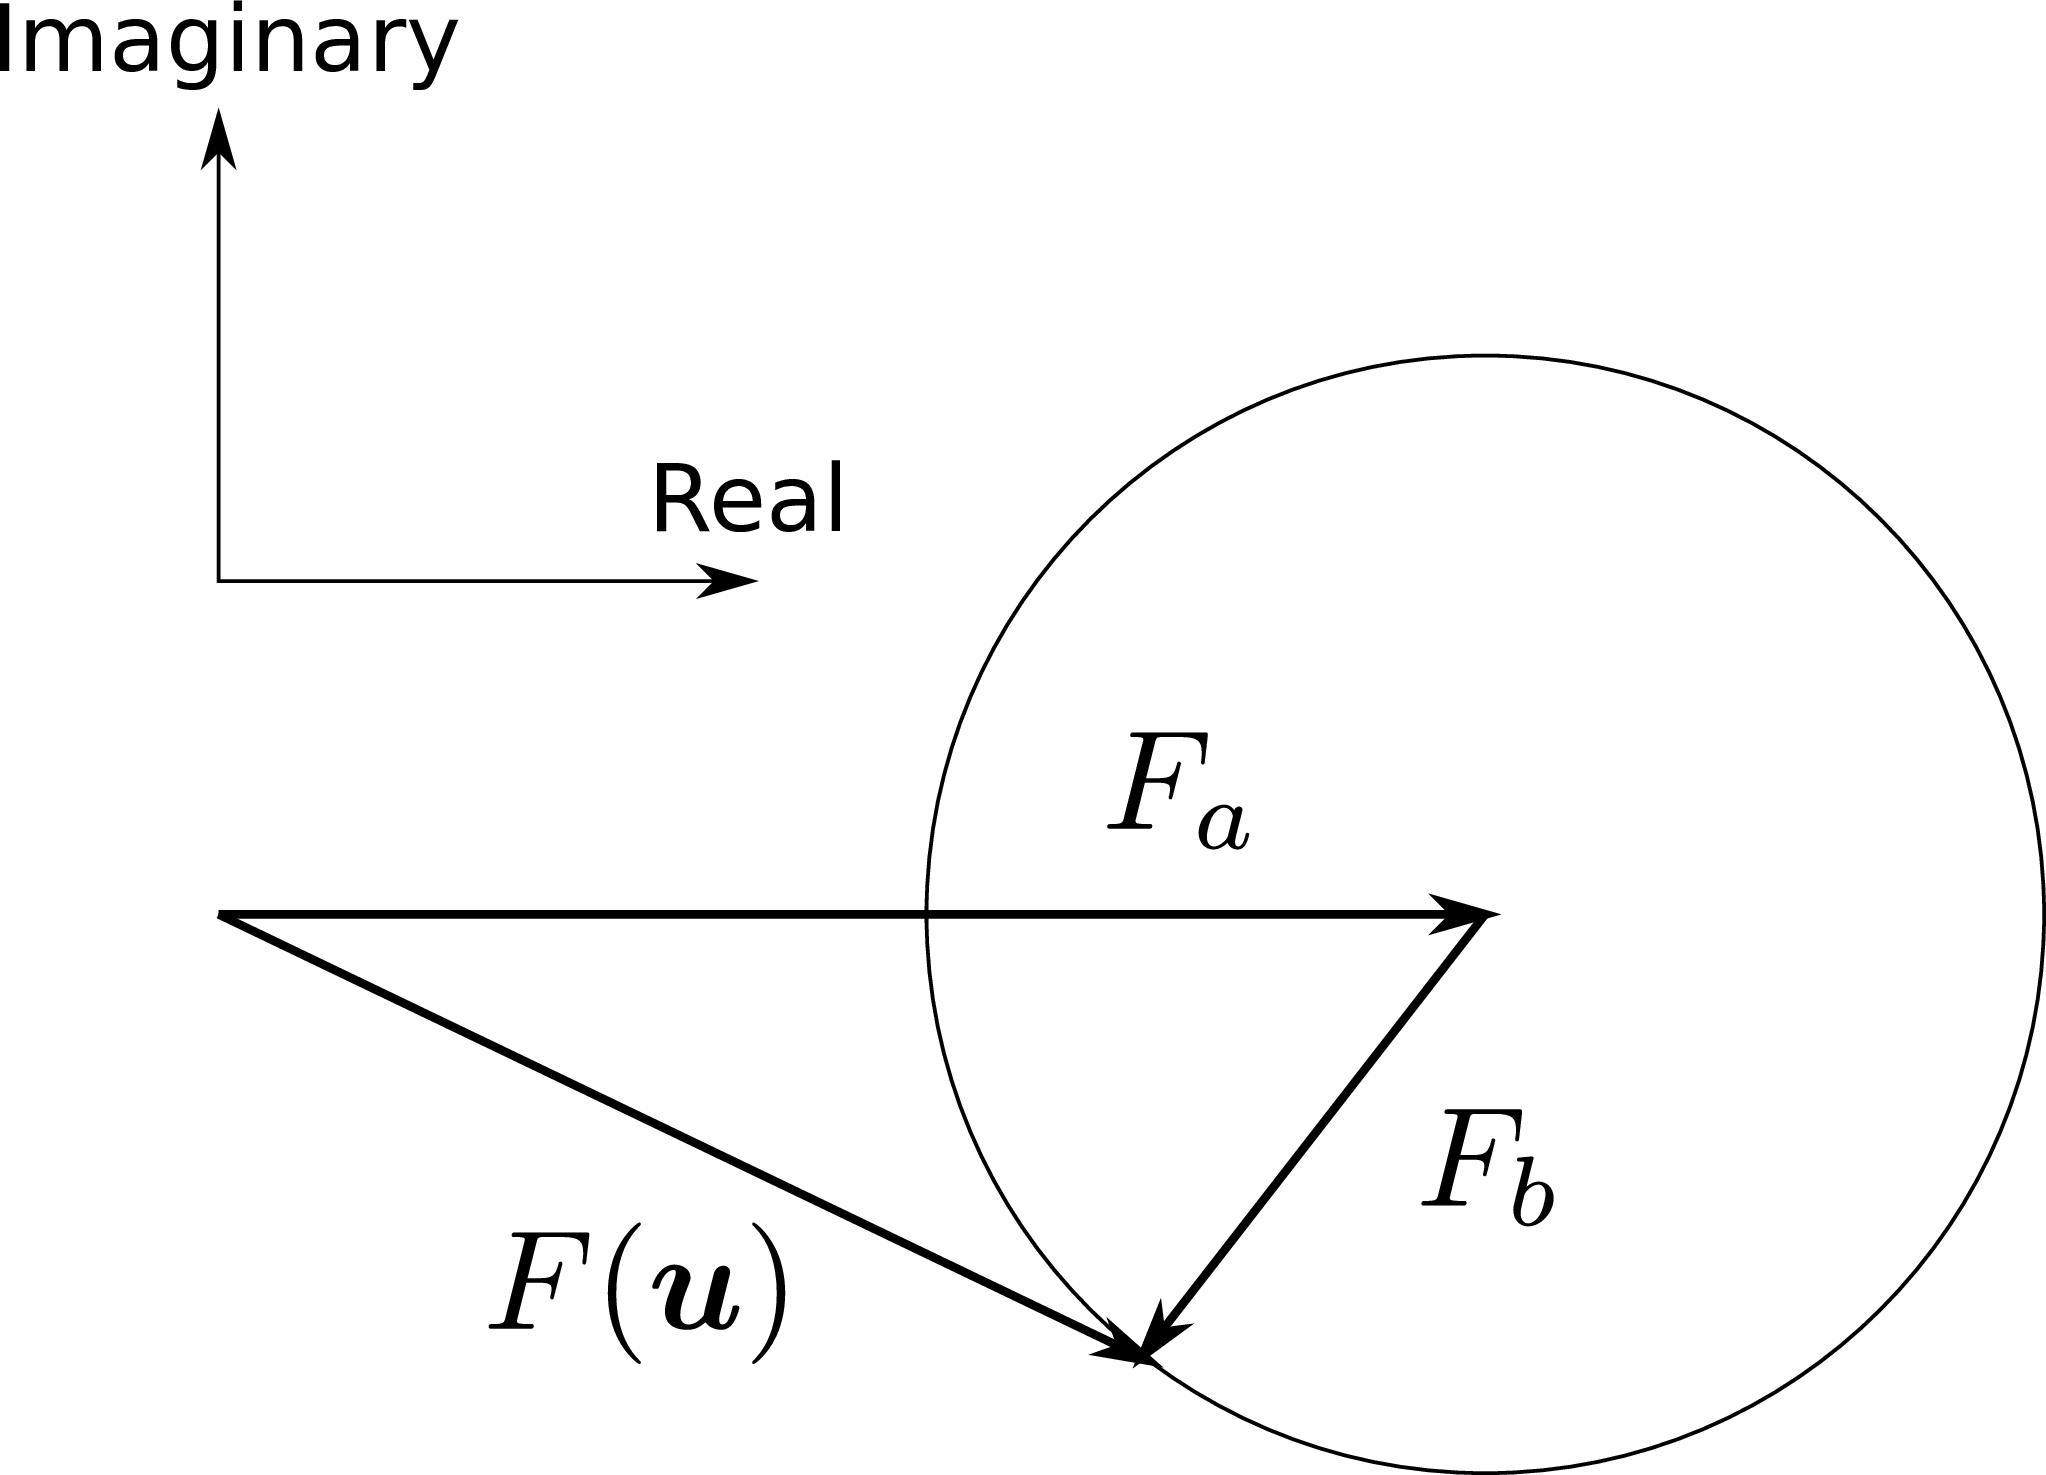
Figure 2.1:
Vector sum representation of the coherent flux F(
→u) of a binary system composed of two point sources of flux F
a and F
b. SVG file:
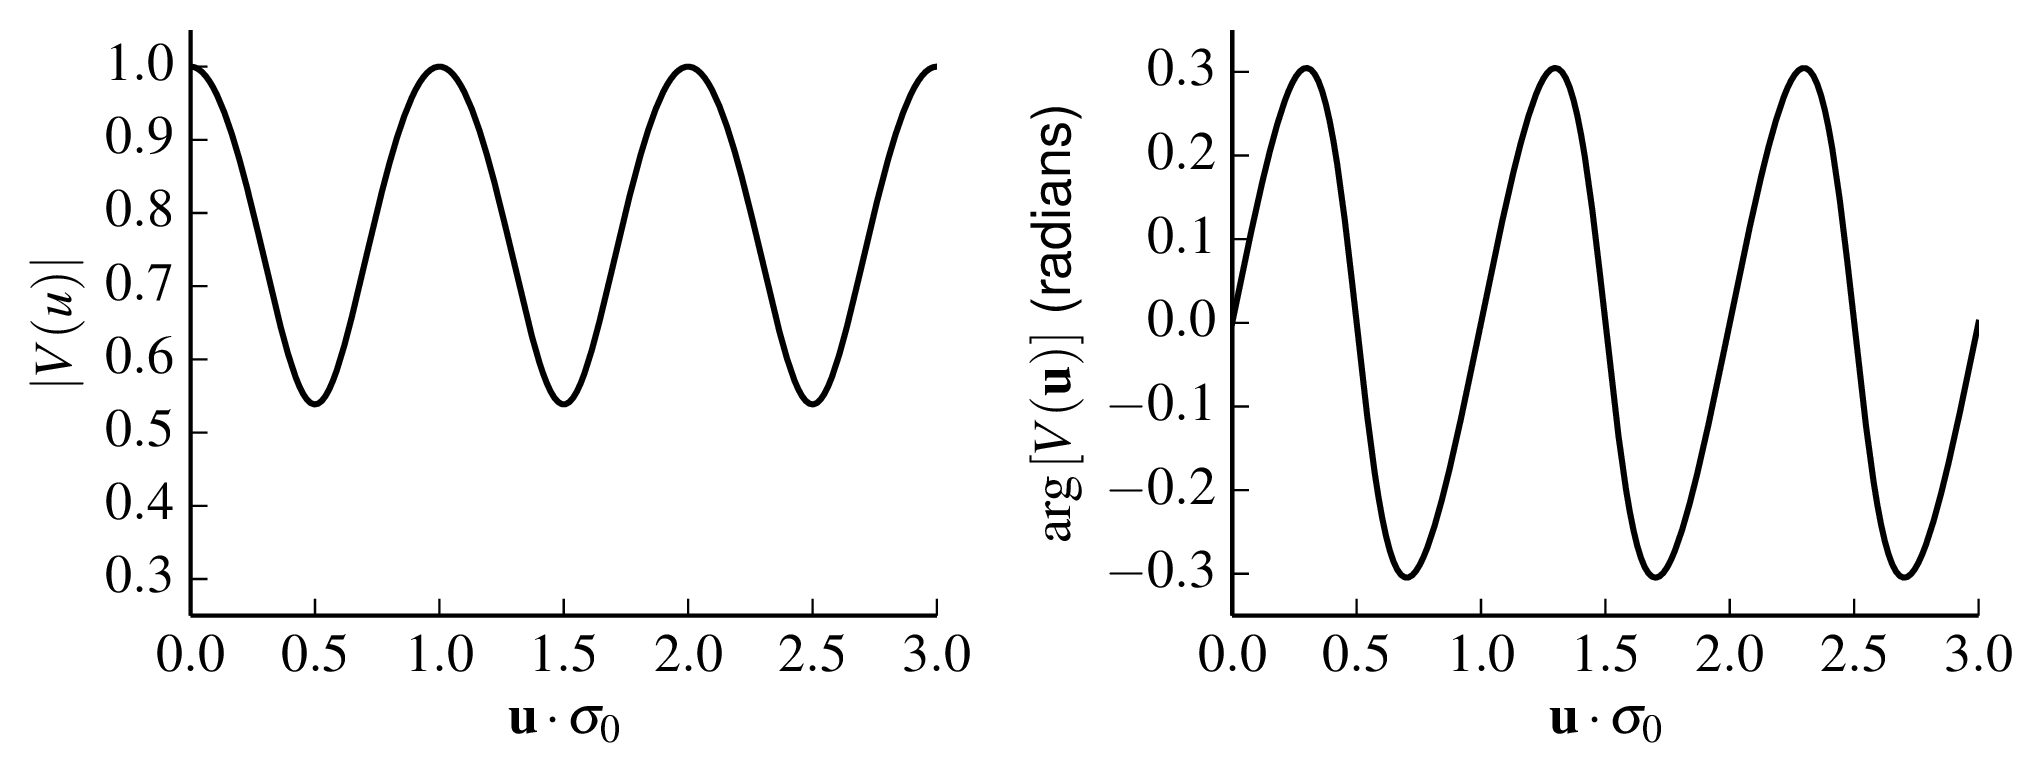
argand.svgFigure 2.2:
Visibility modulus (left) and phase (right) of a binary star with vector separation
→σ
0 as a function of the normalised projected baseline
→σ
0·
→u. The flux of the secondary star is 30% of that of the primary star. Python file:
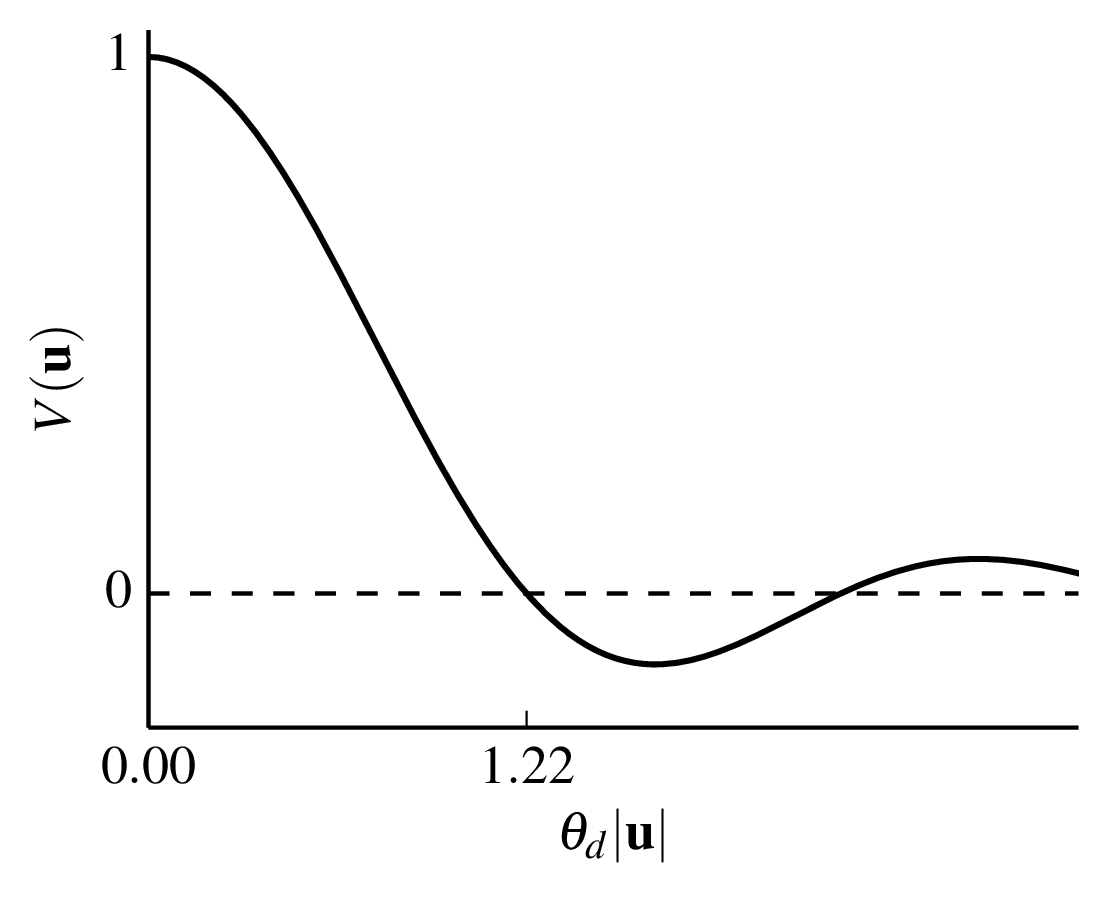
binaryvis.pyFigure 2.3:
Visibility of a point source a uniform disc such as a star. For a star at the phase centre the visibility is purely real. Python file:
discvis.pyFigure 2.4:
Visibility function for a Gaussian disc. Python file:
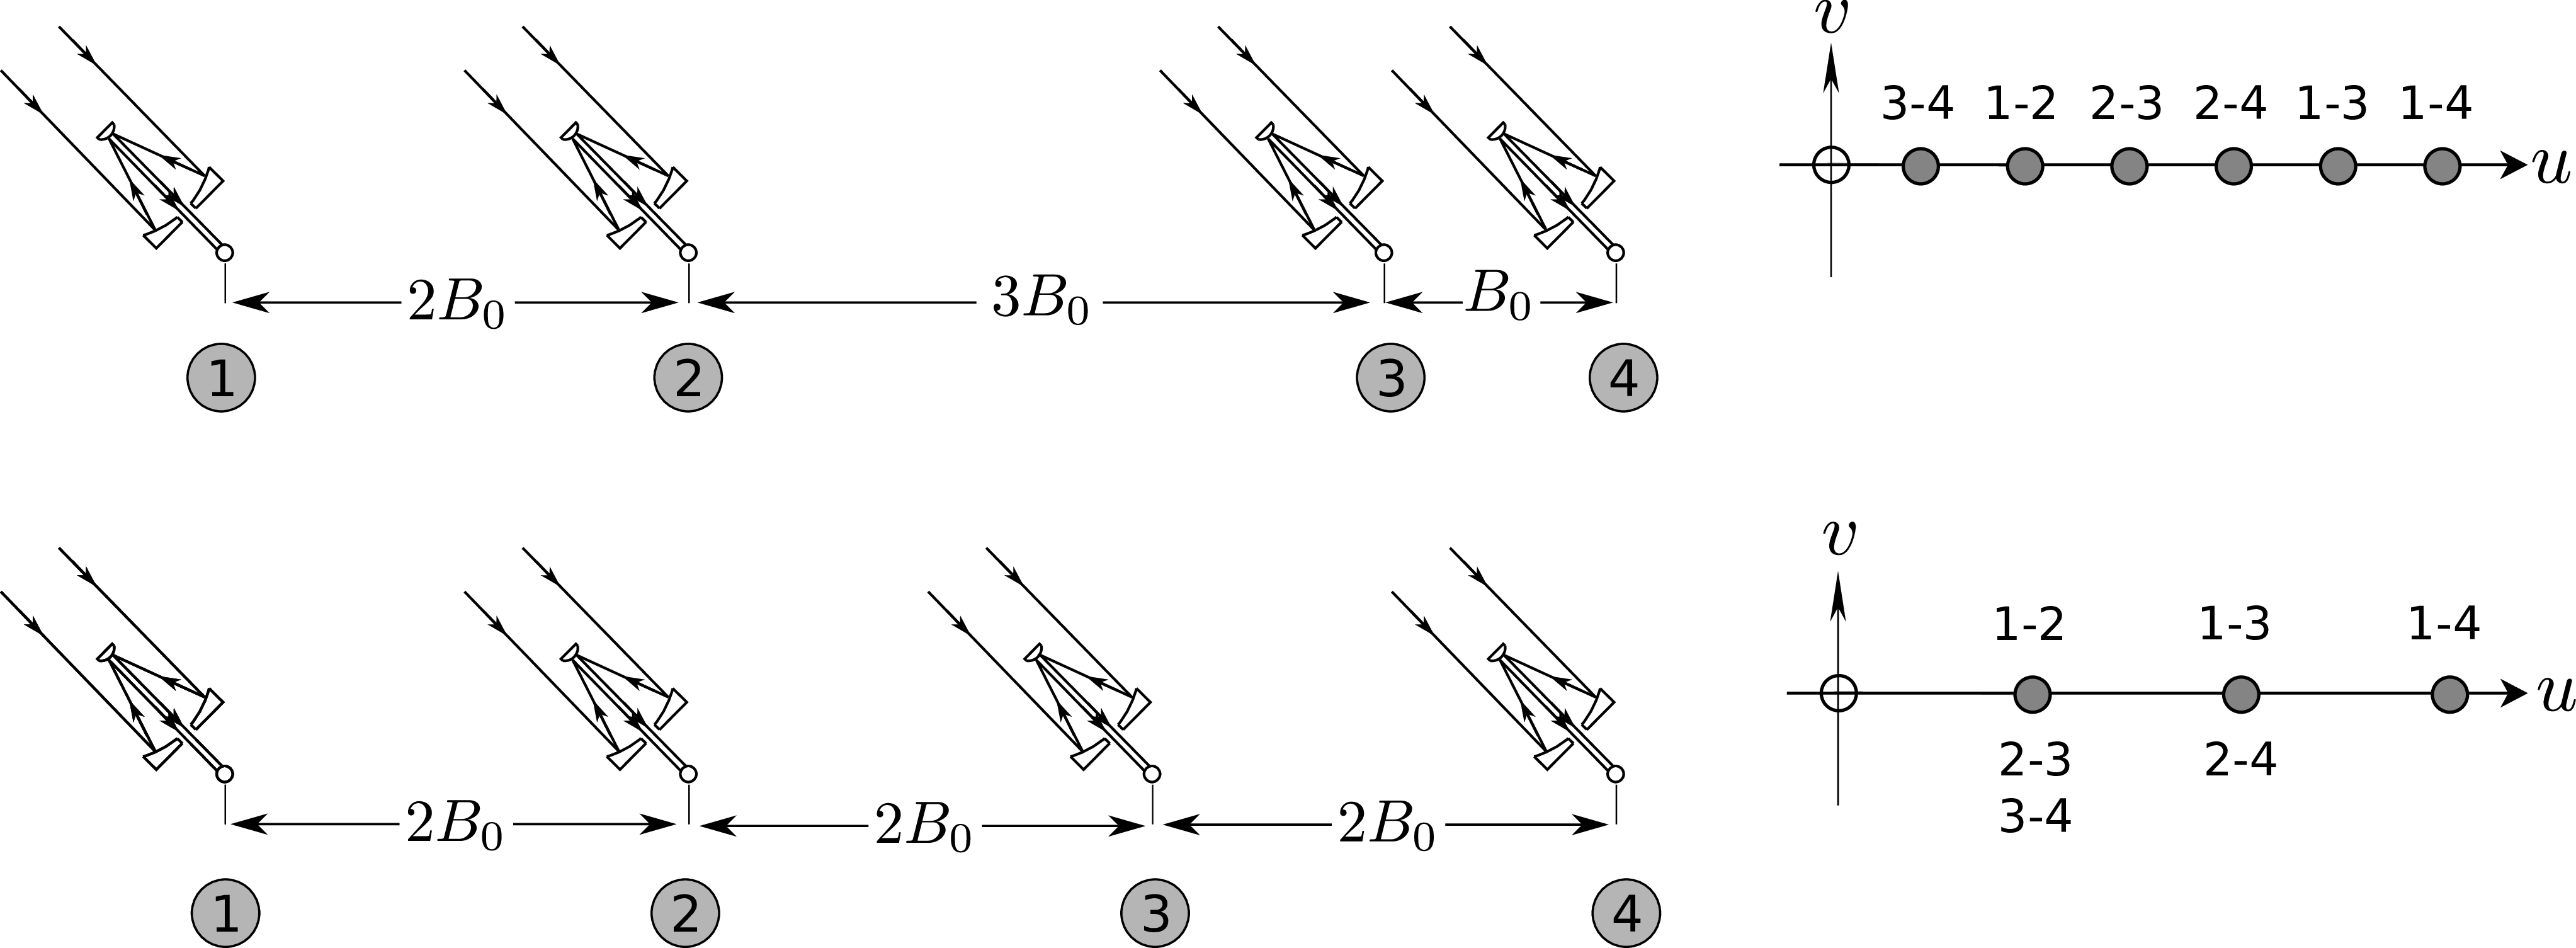
gaussian.pyFigure 2.5: Telescopes arranged in different 1-dimensional configurations (left) and the corresponding baseline sampling, labeled with the telescope pairs that sample that baseline (right). The lower configuration is termed "redundant" because at least one baseline is repeated, and as a result fewer distinct (u,v)points are sampled. SVG file:
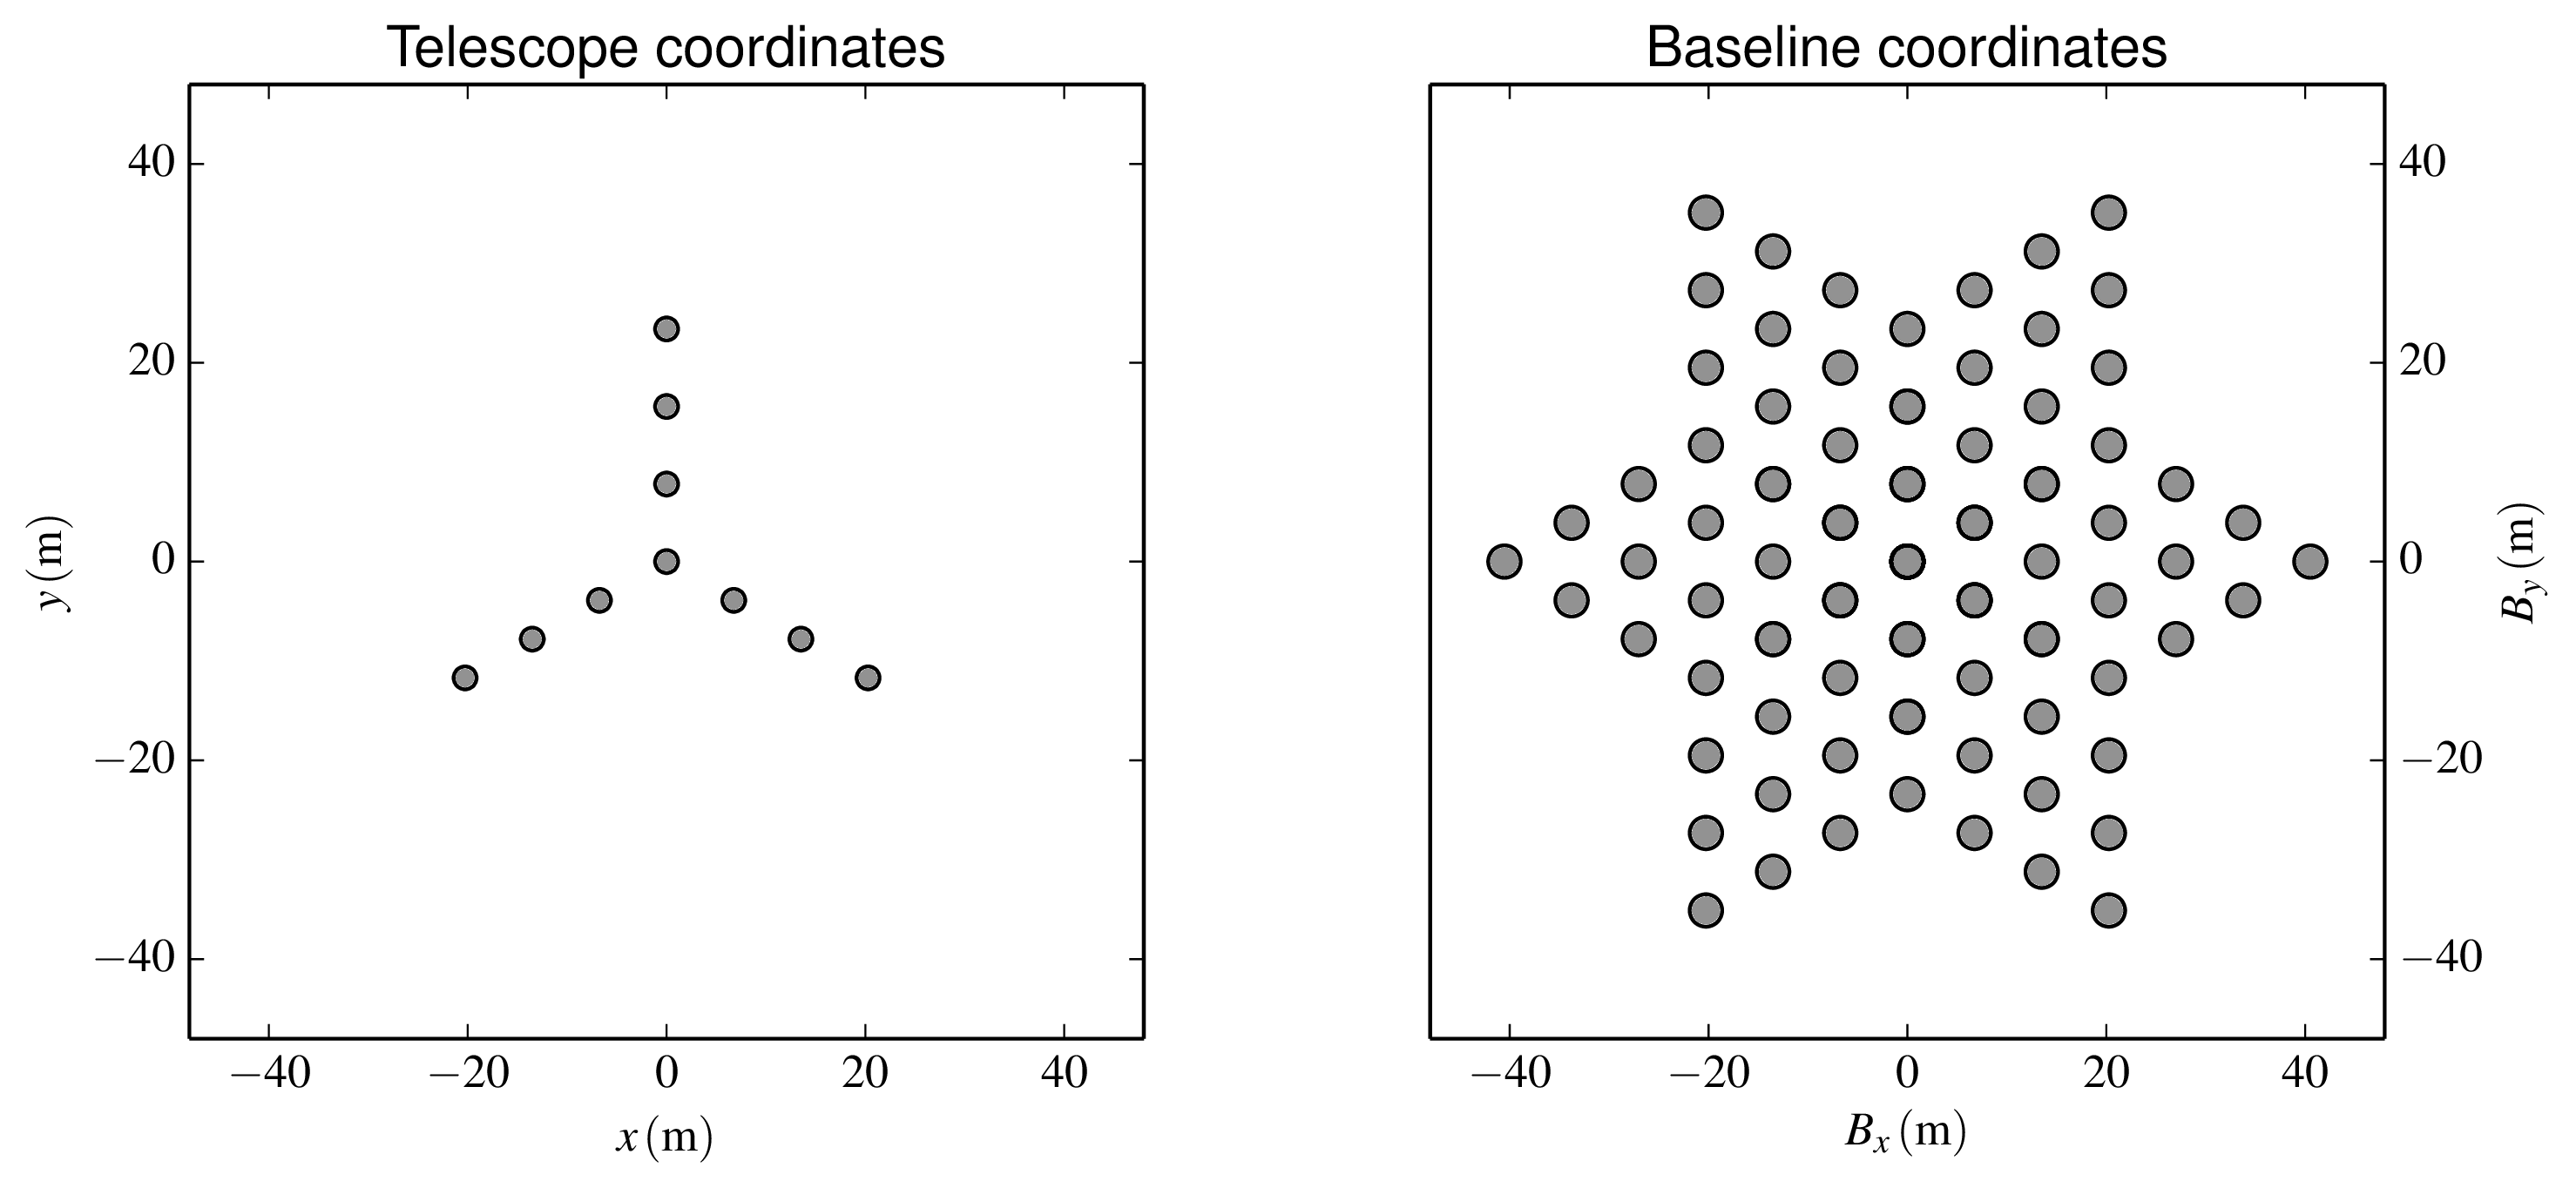
redundant.svgFigure 2.6: A telescope layout for the Magdalena Ridge Observatory Interferometer (left) and the resulting baseline coverage (right). Python file:
mroi-uv.pyFigure 2.7: The baseline vector
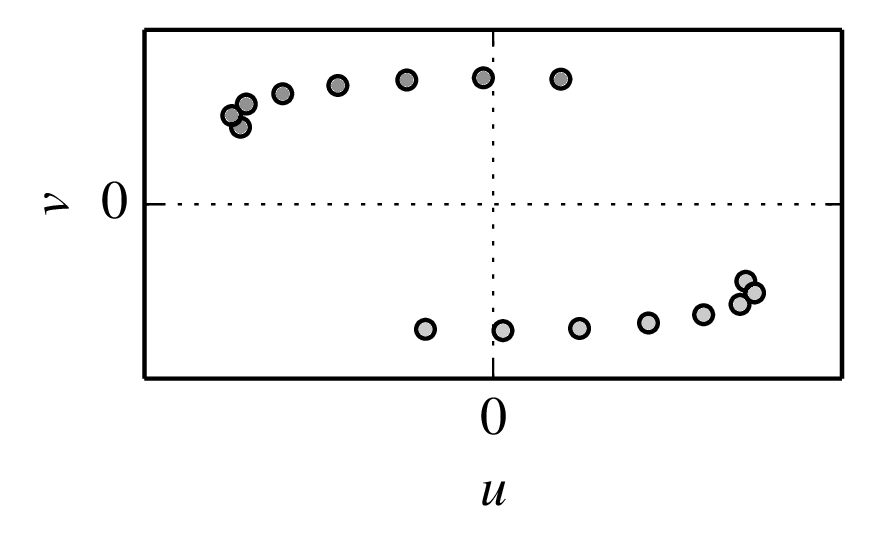
→B rotating about the Earth's axis (left) and the corresponding (u,v)coverage for an 8-hour track for the observation of an example source (right). The (u,v)coverage is shown with one observation per hour of track. Each observation gives two (u,v)samples due to the Hermitian symmetry of the Fourier transform. SVG file:
baseline-rotation.svg Python file:
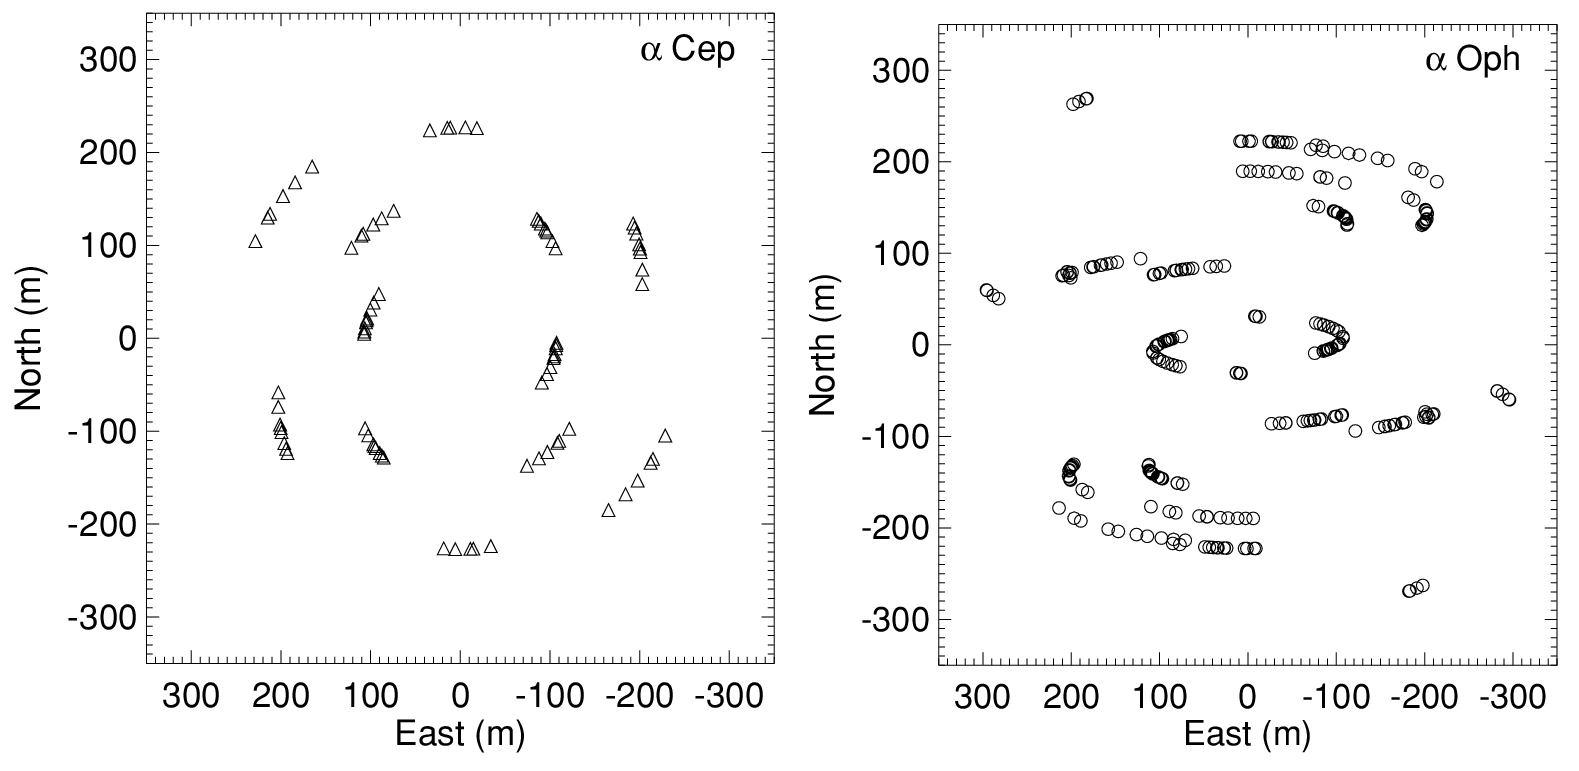
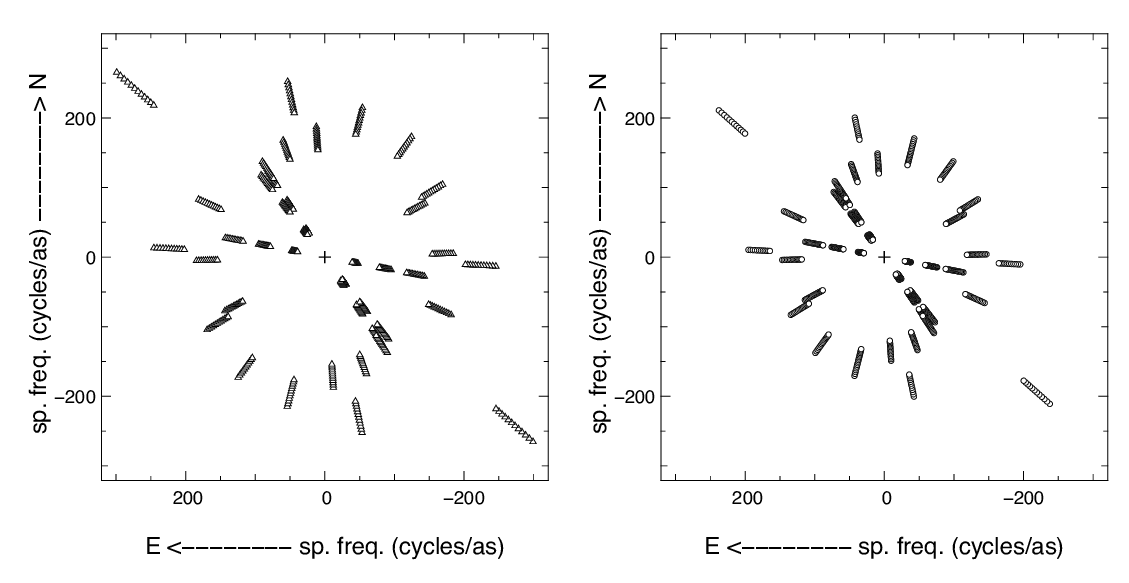
earth-rotation-partial.pyFigure 2.8: Earth-rotation synthesis tracks for the CHARA telescope array observations of two different stars, from . The star α Cephei is relatively close to the celestial pole (declination ≈ 63\nobreak°\xspace) and so the (u,v)tracks on the are more circular while α Ophiuchi is nearer to the celestial equator (declination ≈ 13\nobreak°\xspace) and so the (u,v)tracks are more elongated.
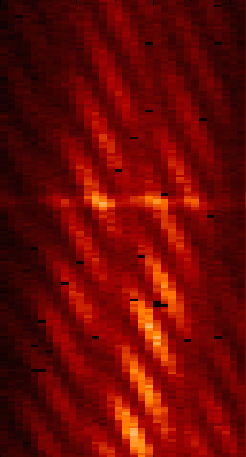
Figure 2.9: Wavelength synthesis (u,v)coverage of VLTI observations of the star HD87643 in the astronomical H (left) and K (right) bands (from ). The radial lines are due to the different spatial frequencies observed on the same baseline at different wavelengths within these bands.
Figure 2.10:
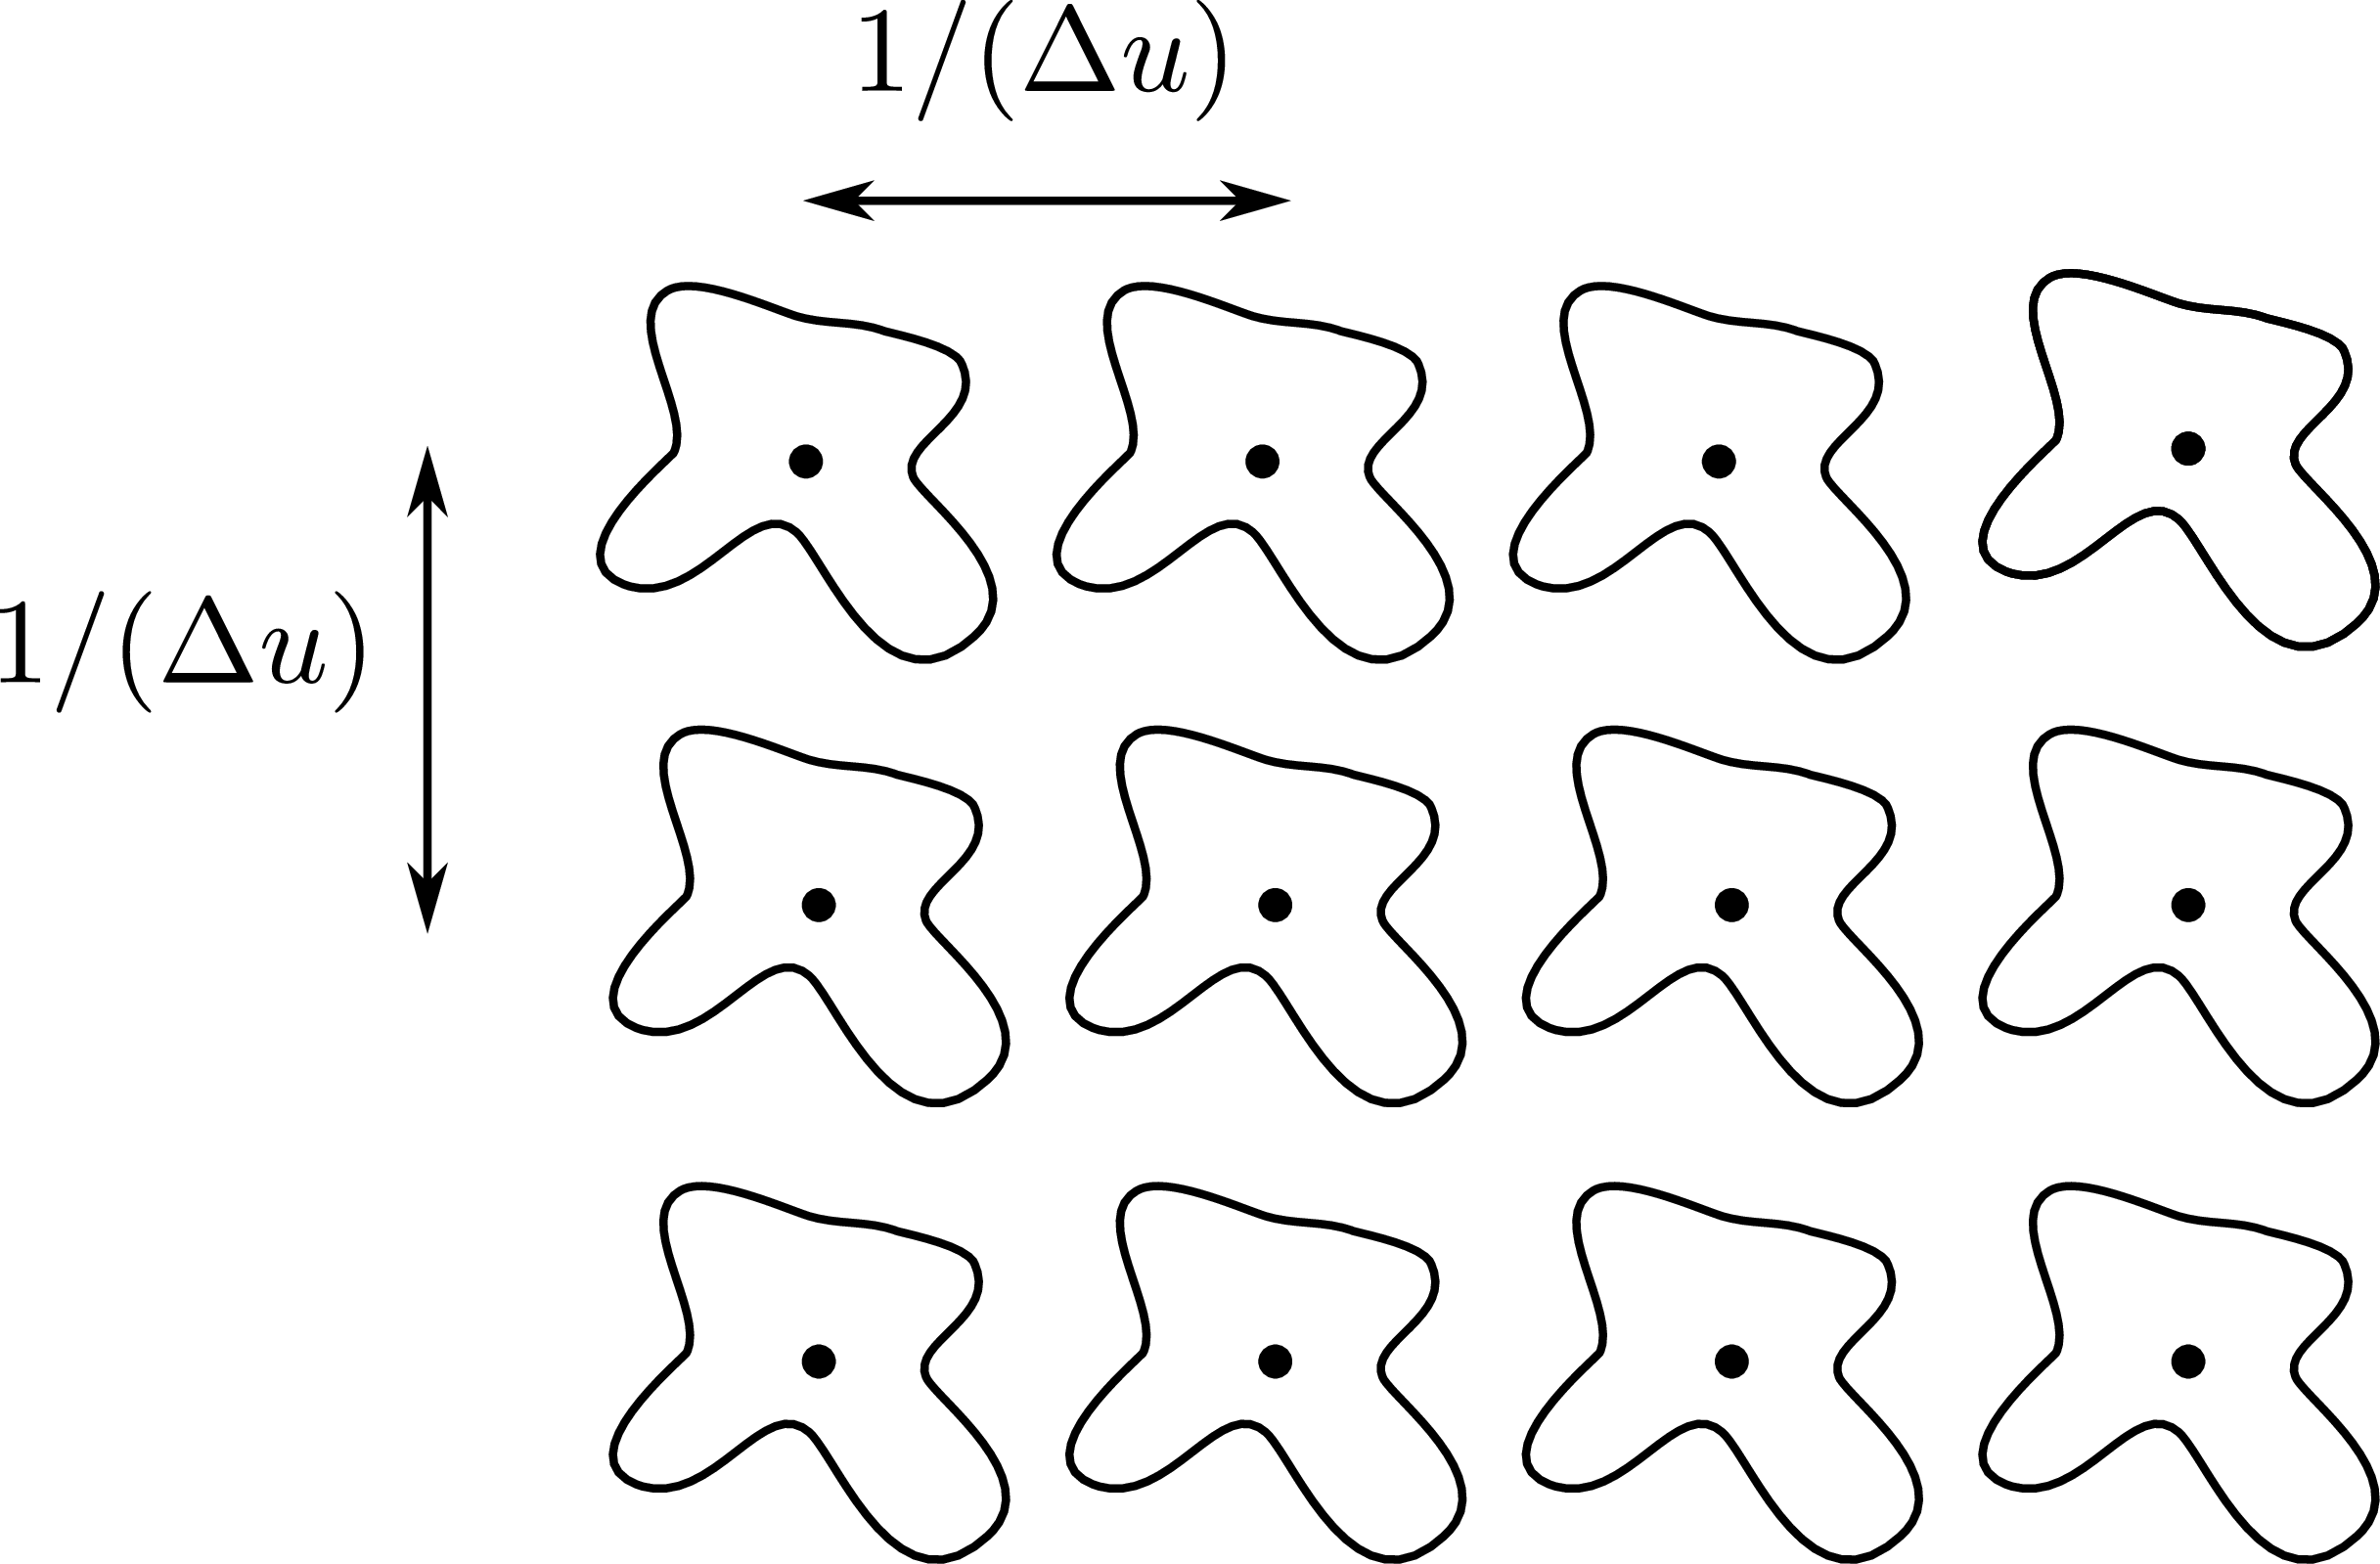
The "lattice" of reconstructed images caused by finite sampling. SVG file:
lattice.svg
