Chapter 8
Data reduction
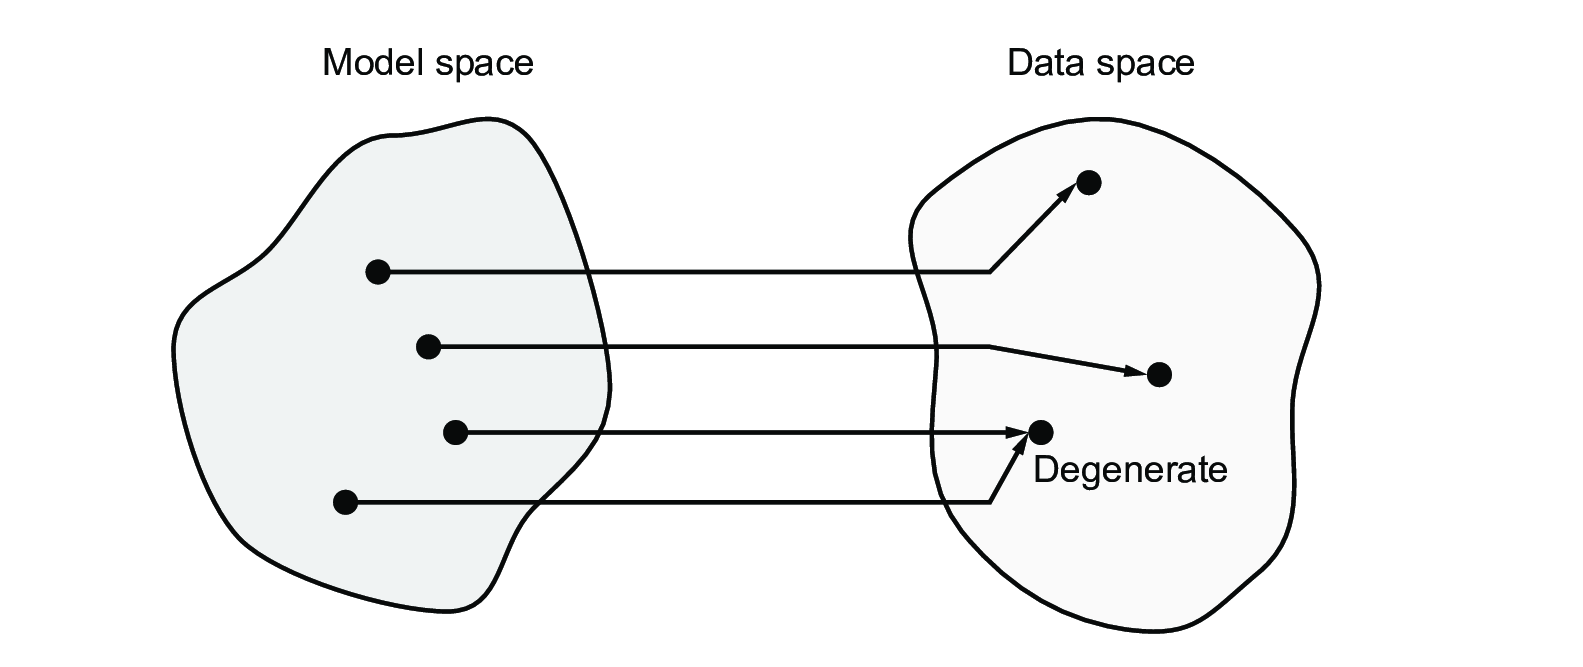 |
Figure 8.1: Schematic outline of the forward problem in scientific inference. SVG file: degeneracy.svg
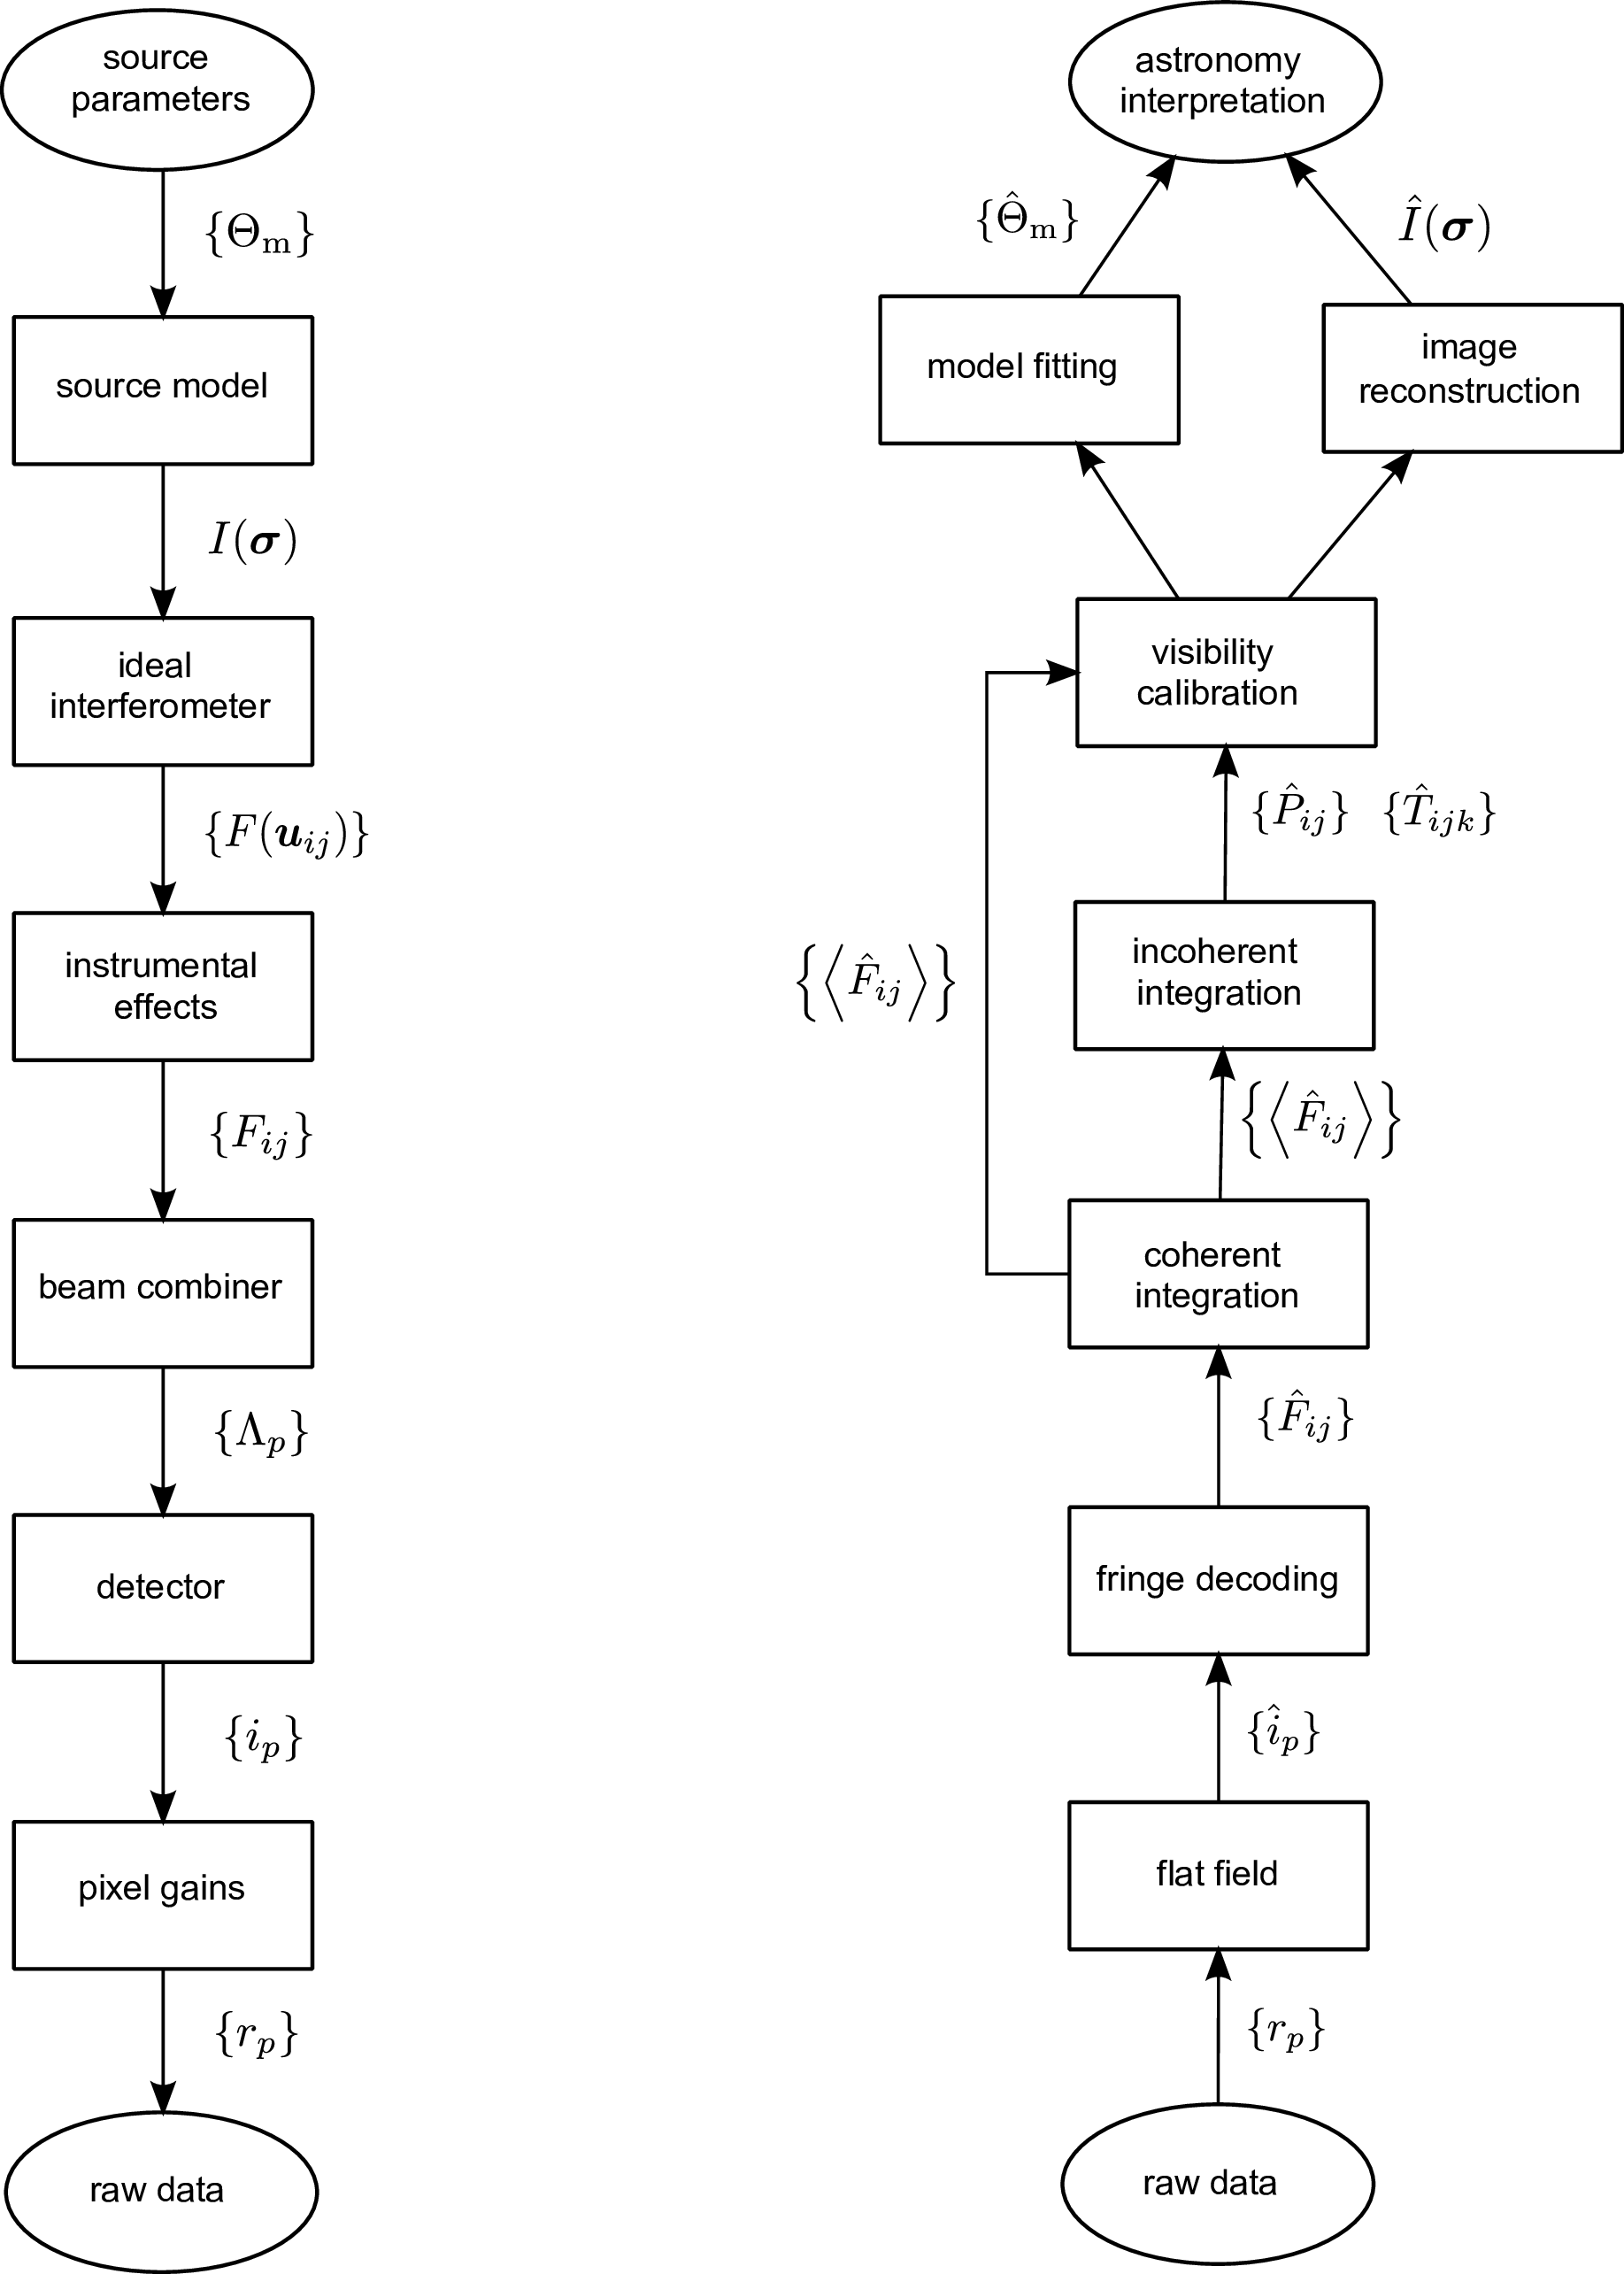 |
Figure 8.2: The forward model of an interferometric measurement (left) and an outline of the data reduction process for interferometric data (right). SVG file: interferometric-forward-and-reverse.svg
[b]0.49
 [b]0.49
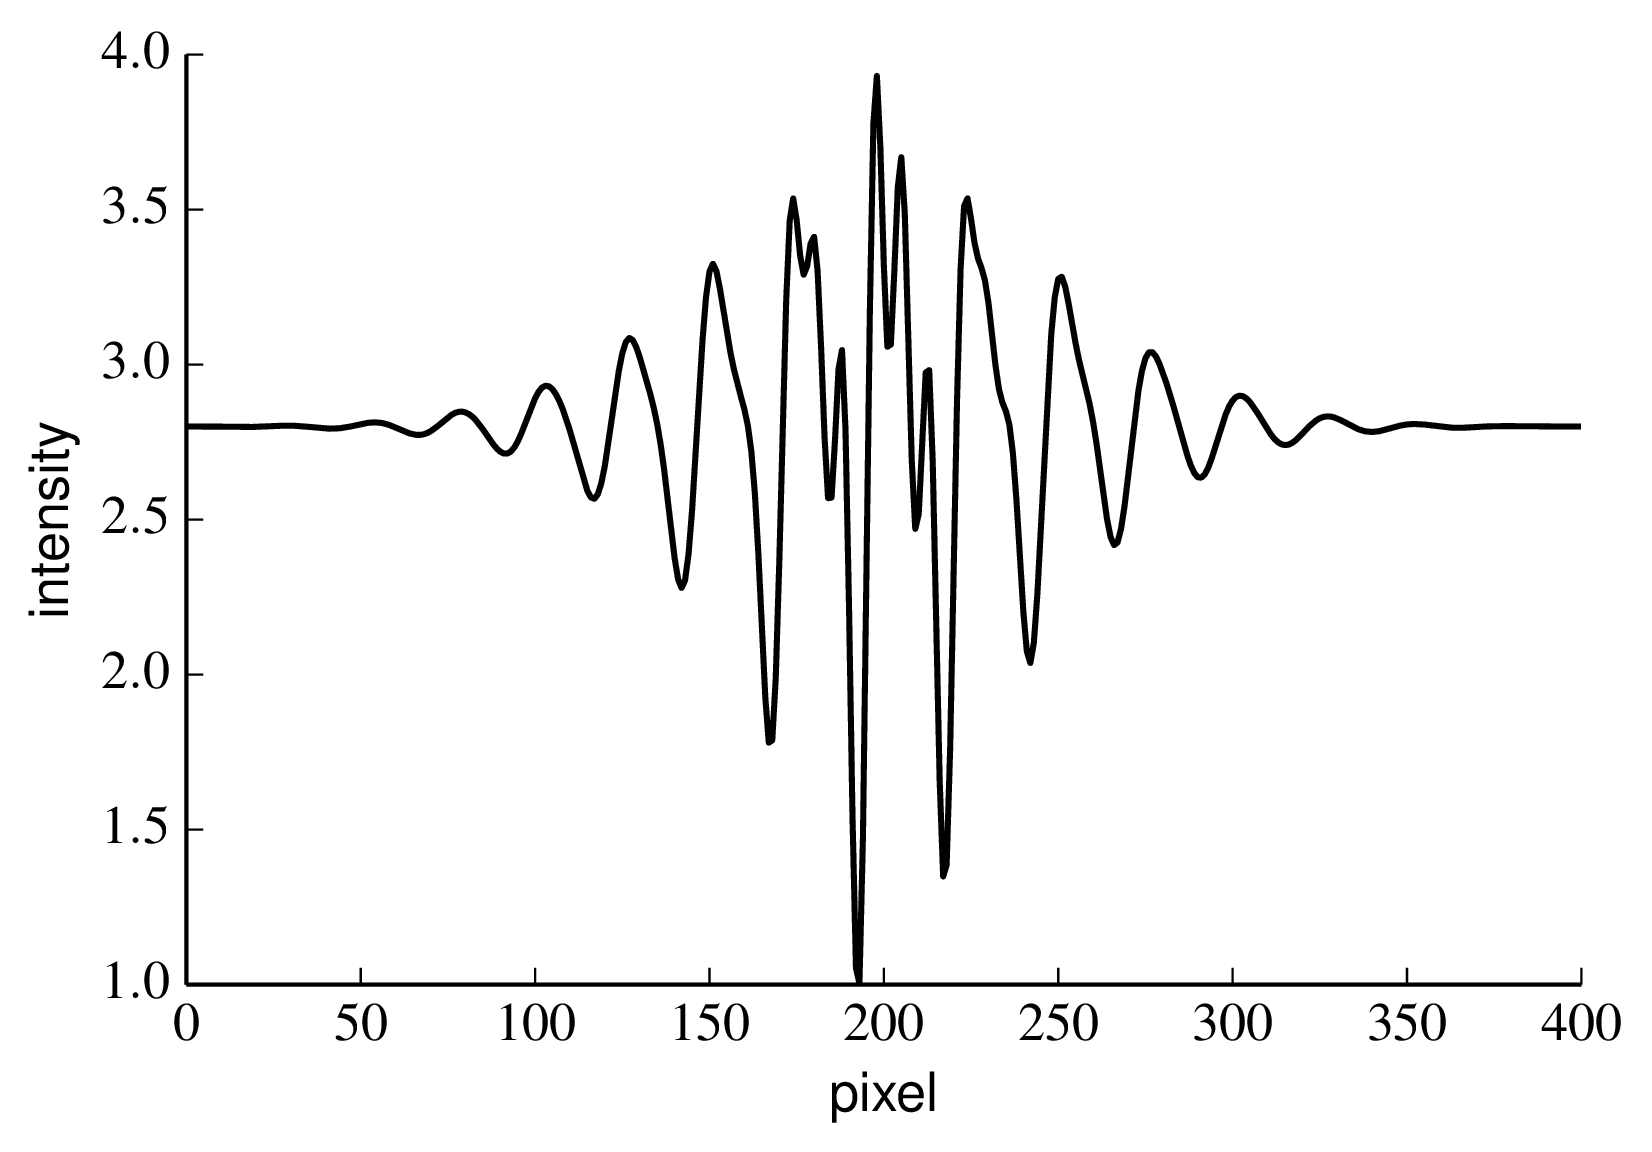
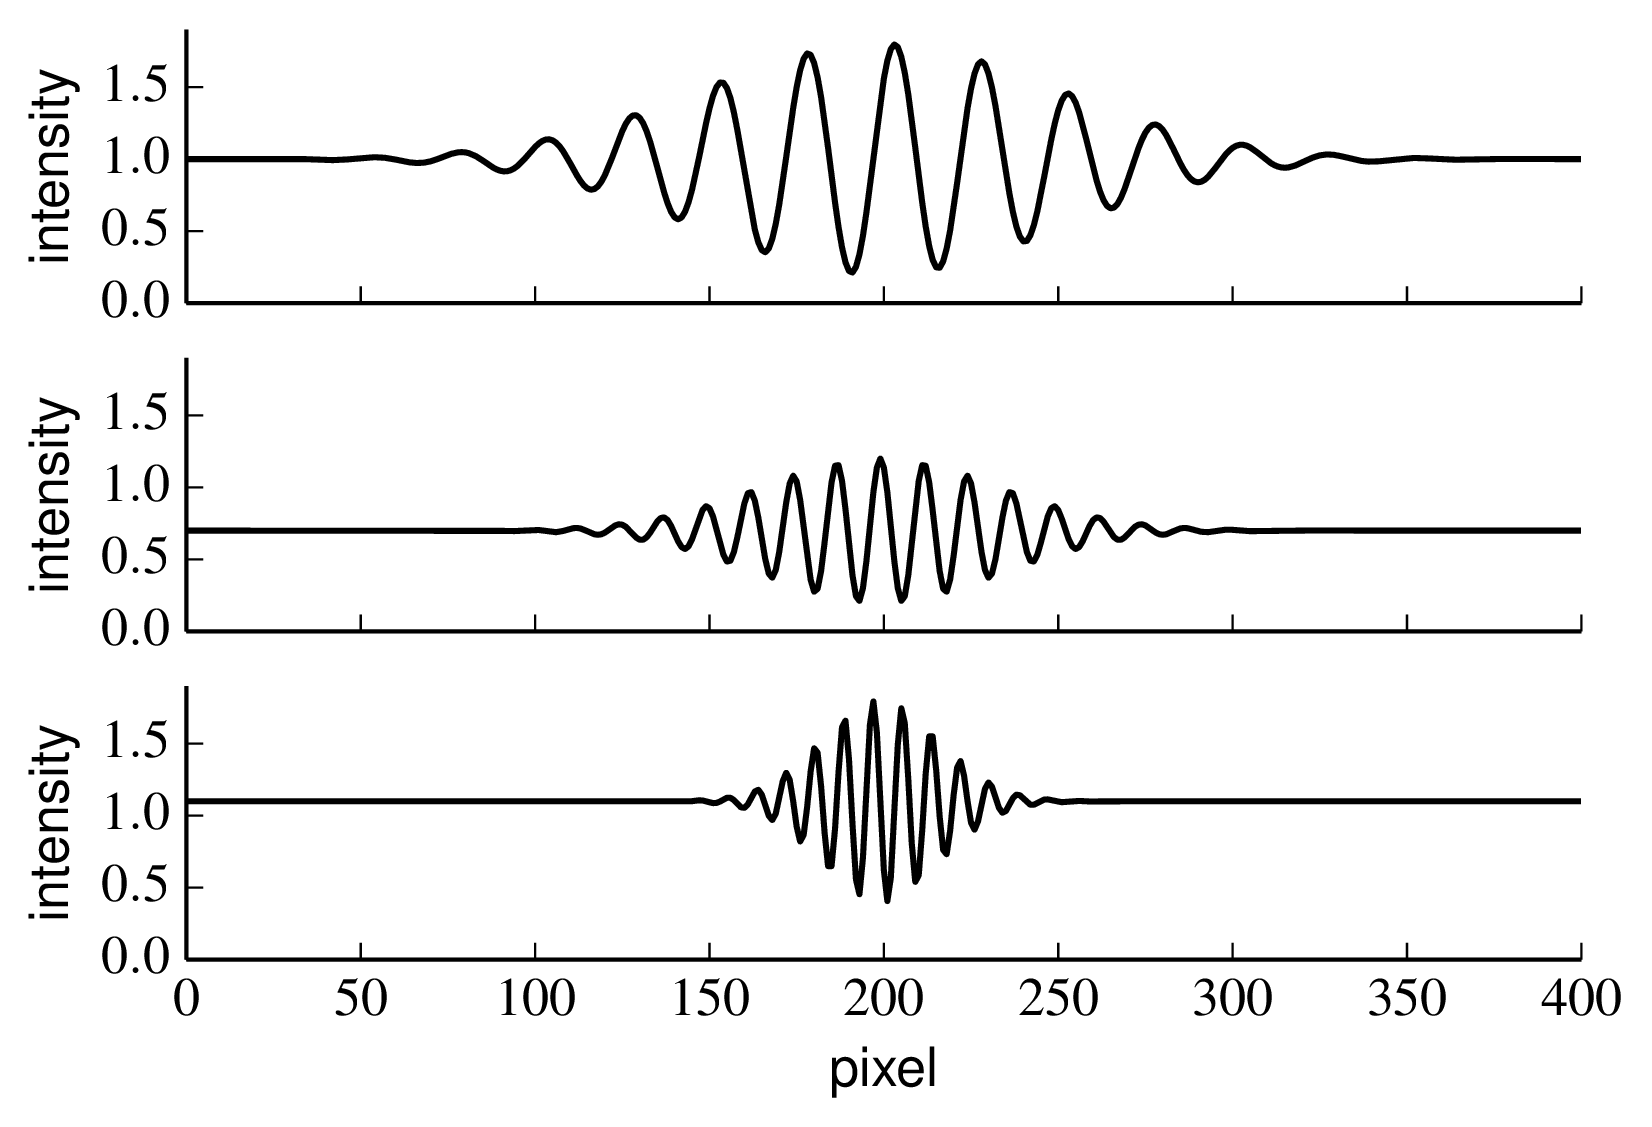
Figure 8.3: A discretely-sampled fringe pattern with an envelope. The individual fringe patterns are shown on the left and the superposed pattern on the right. Python file: component-fringes.py Python file: superposed-fringes.py
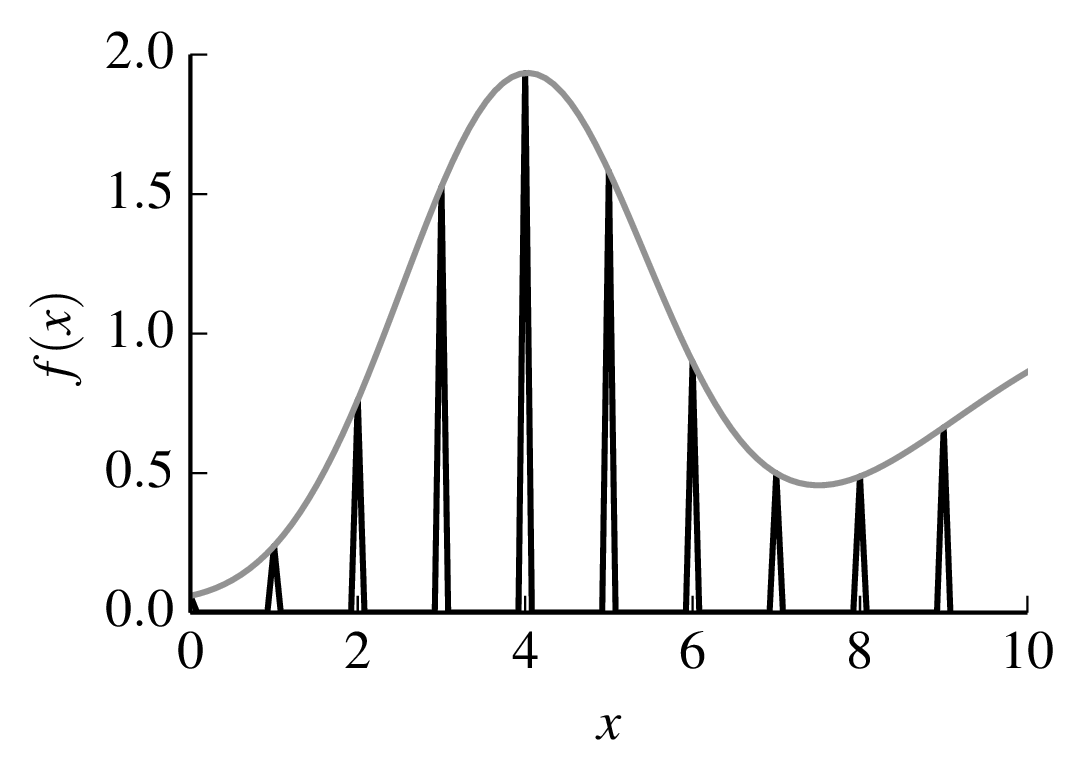 |
Figure 8.4: Discretising a continuous function represented as converting it to a series of Dirac delta functions. Python file: discretising.py
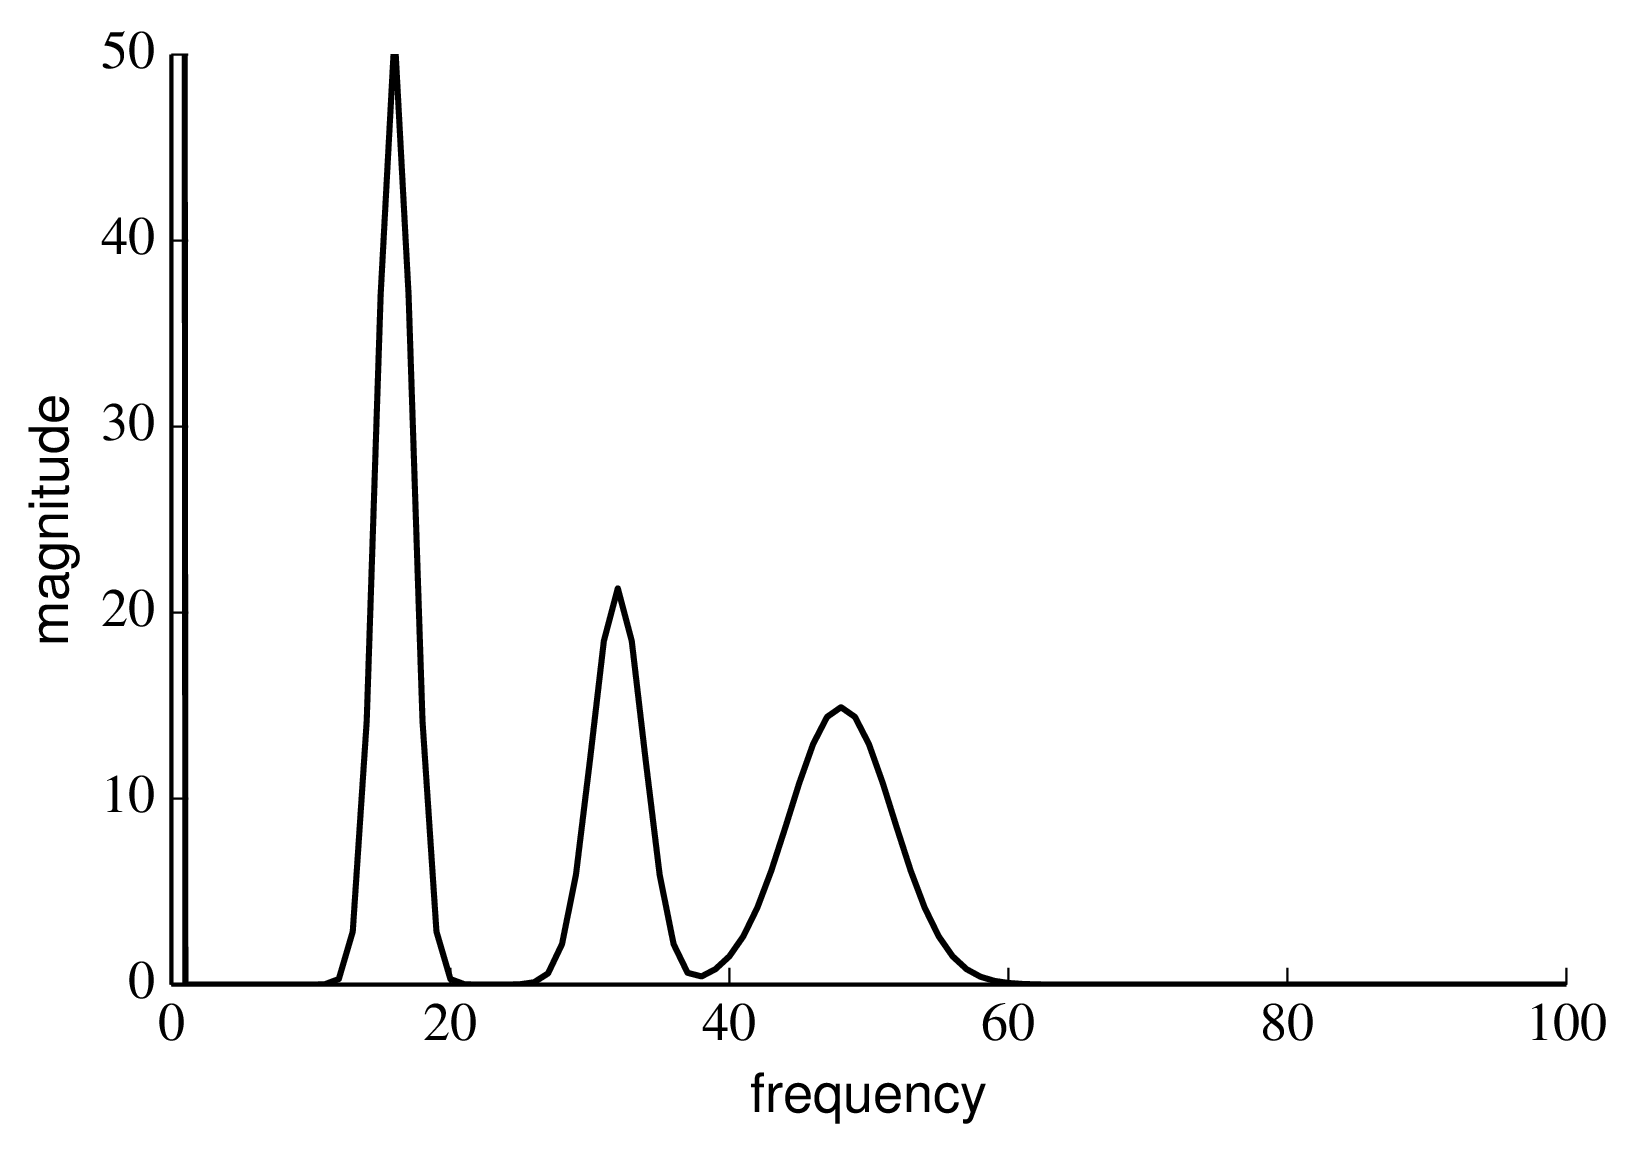 |
Figure 8.5: The magnitude of the DFT of the fringe pattern shown in Figure 8.3. The component at zero frequency has been truncated. Python file: dft-amplitude.py
[b]0.49
 [b]0.49
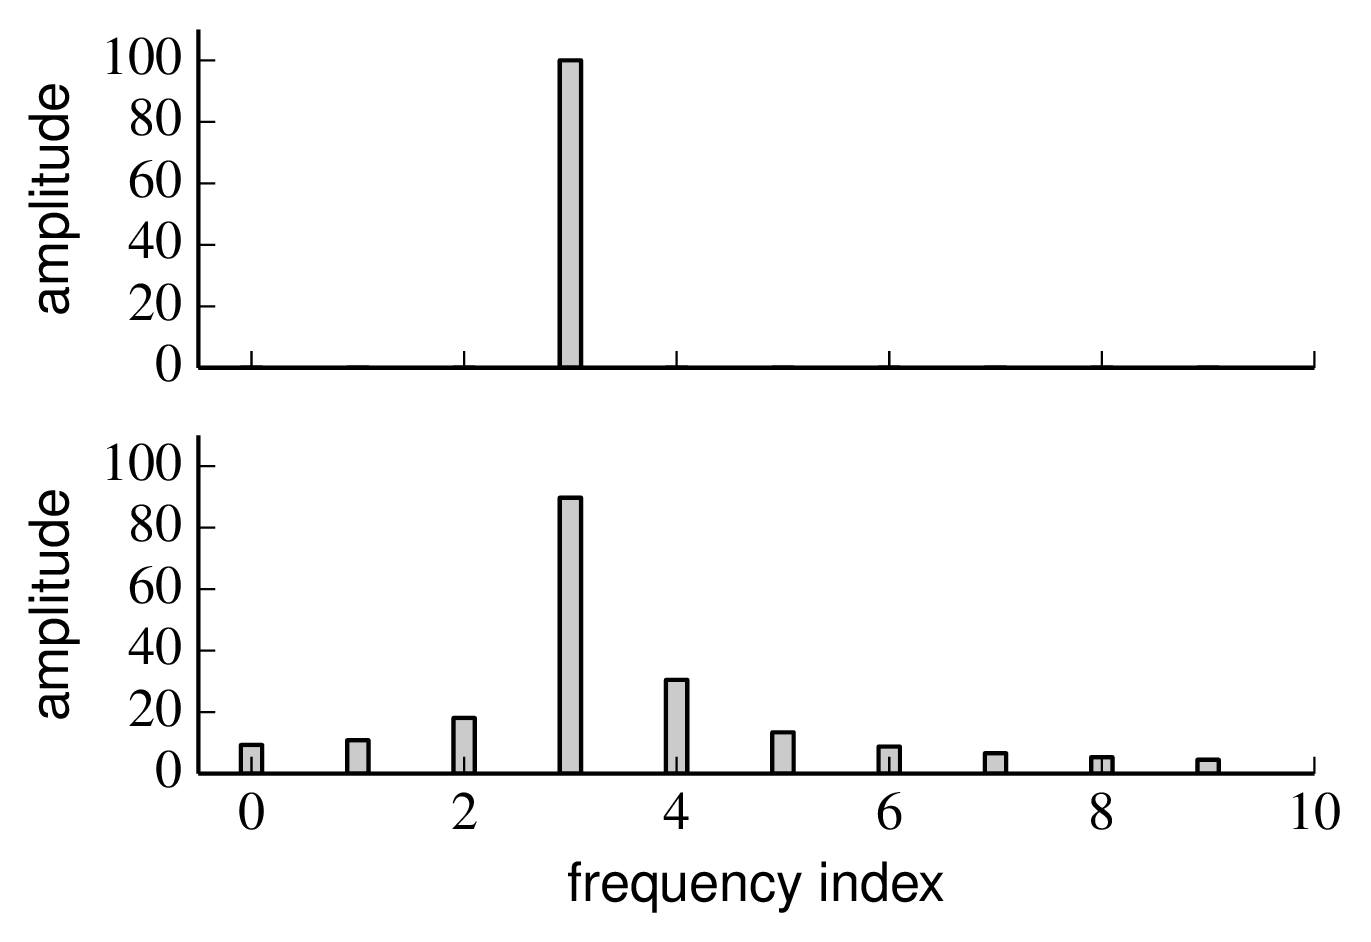
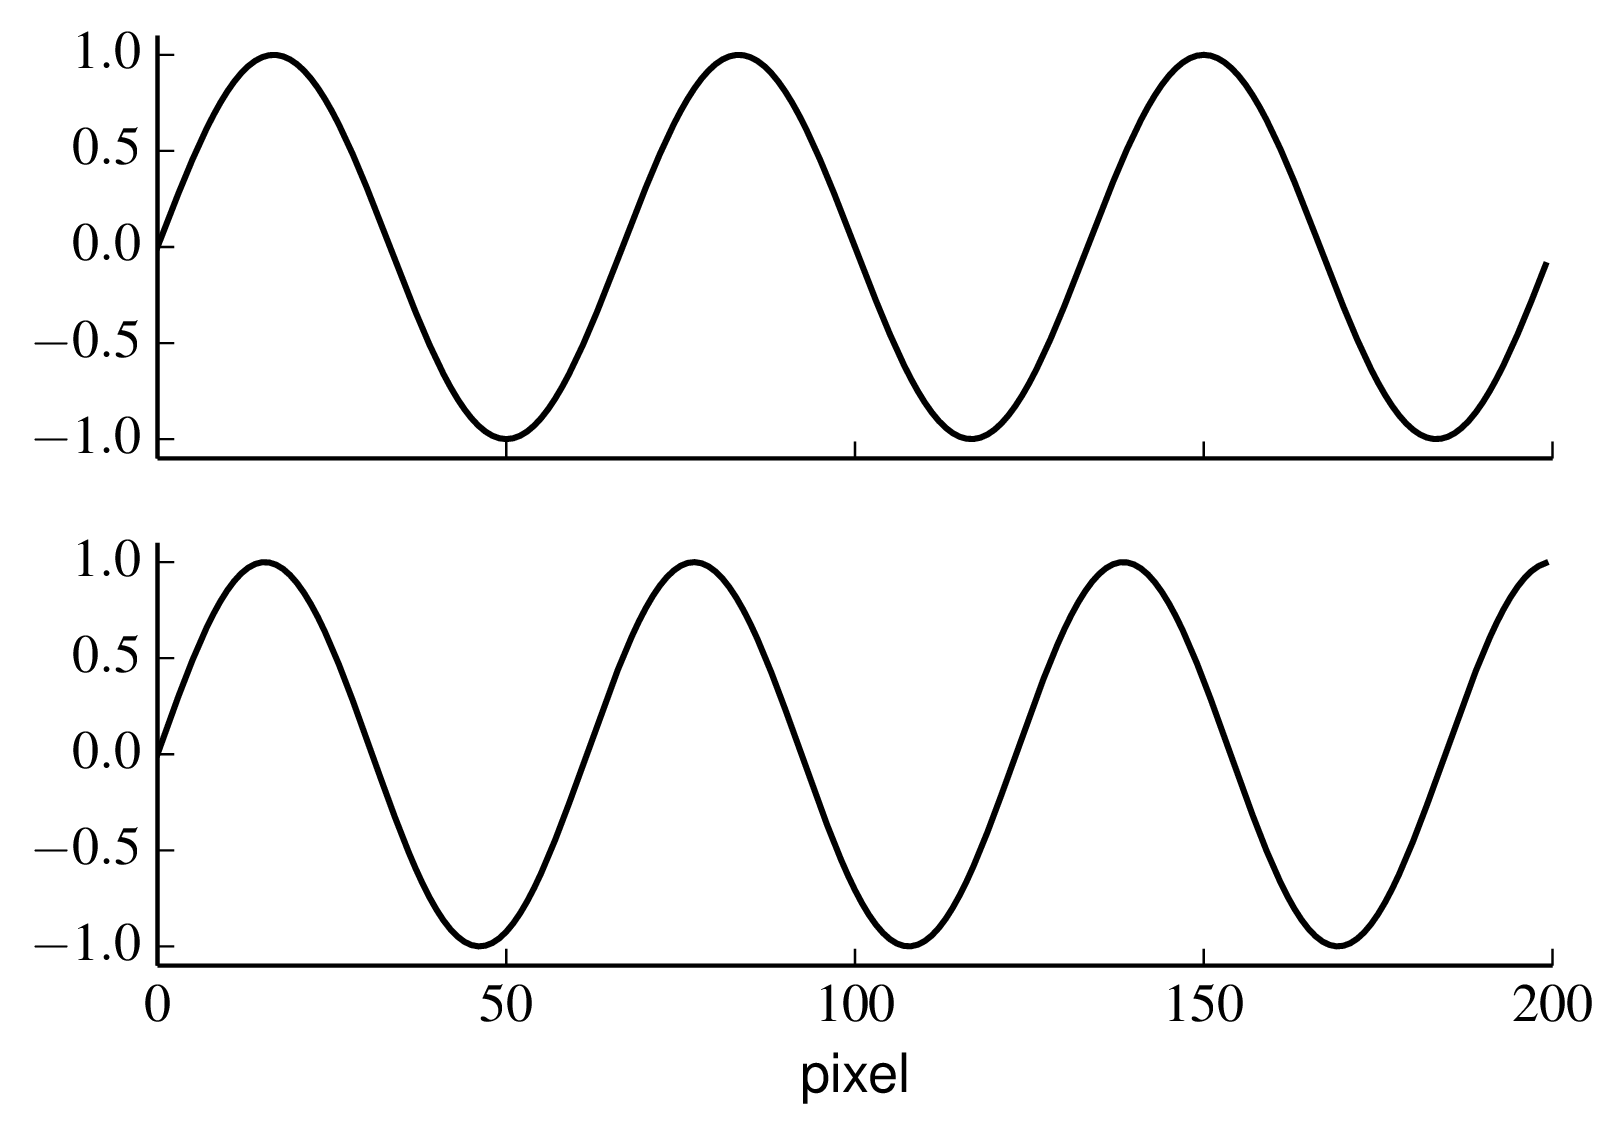
Figure 8.6: A sinusoid with an integral number of fringe cyles over the sampling interval (upper left) and with a non-integral number of fringe cycles (lower left) and their corresponding discrete Fourier transforms (right). The DC value of the fringe pattern has been set to zero to provide greater clarity. Python file: leakage-sine.py Python file: leakage-fourier.py
[b]0.49
 [b]0.49
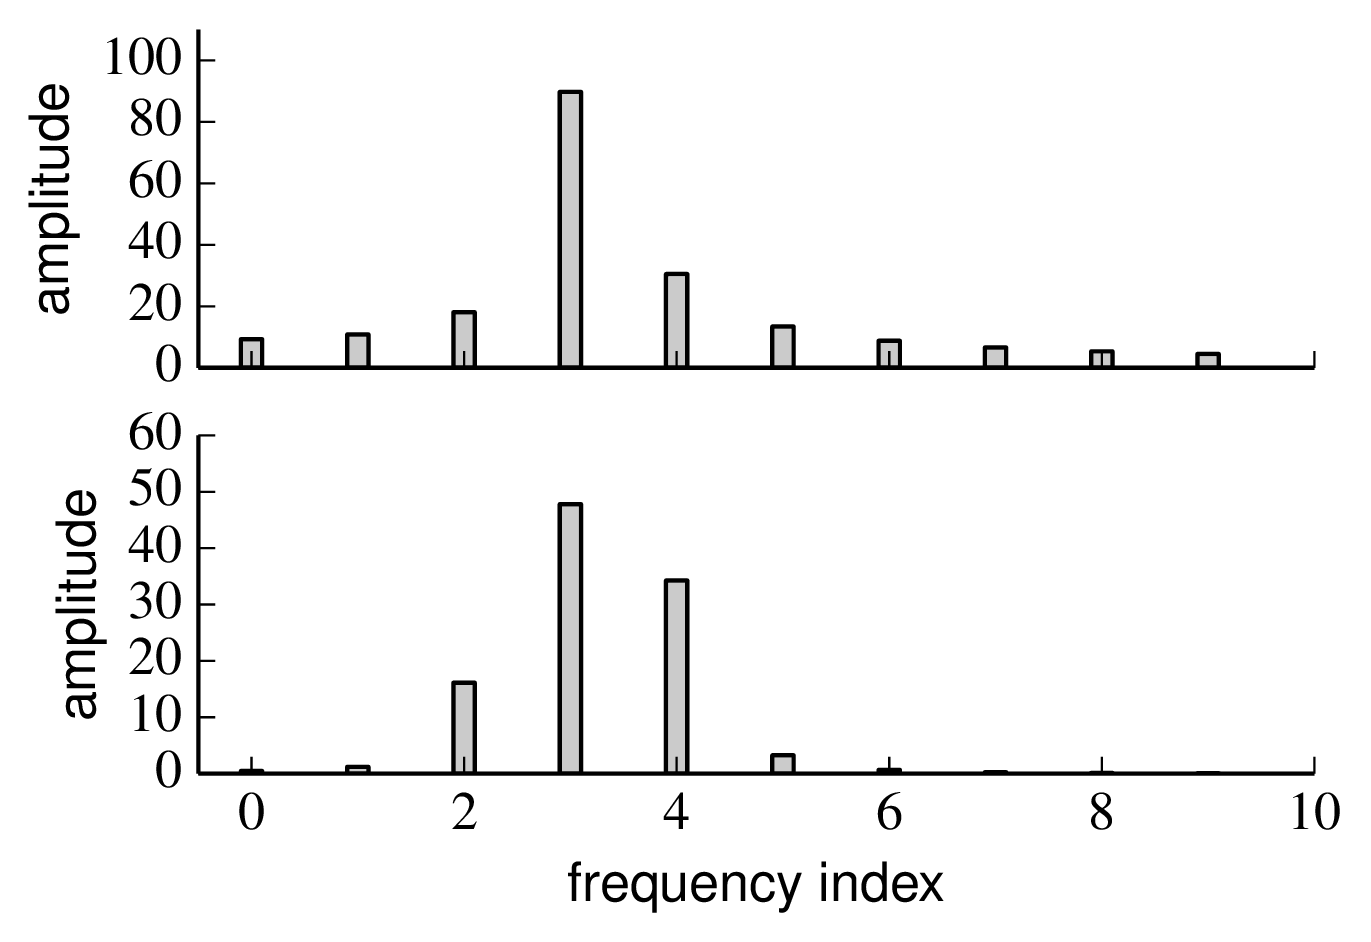
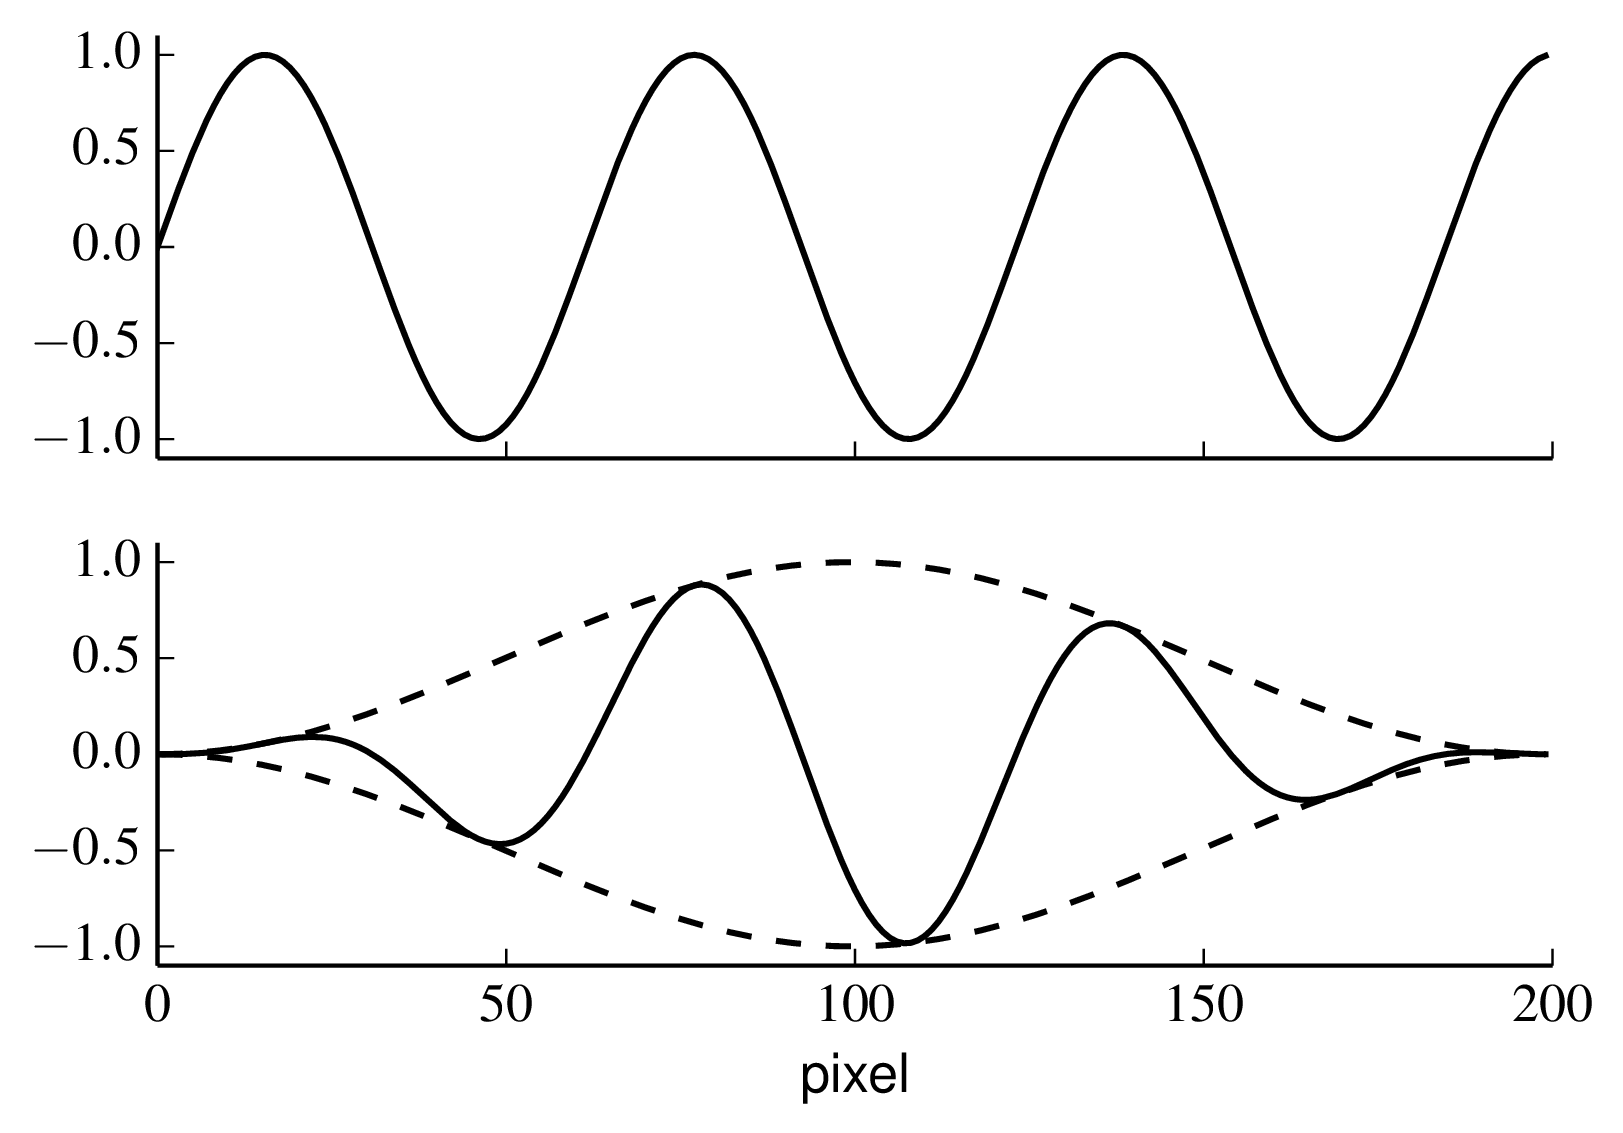
Figure 8.7: Windowing by a Gaussian (left) and its effect on spectral leakage (right). Python file: window-sine.py Python file: leakage-window.py
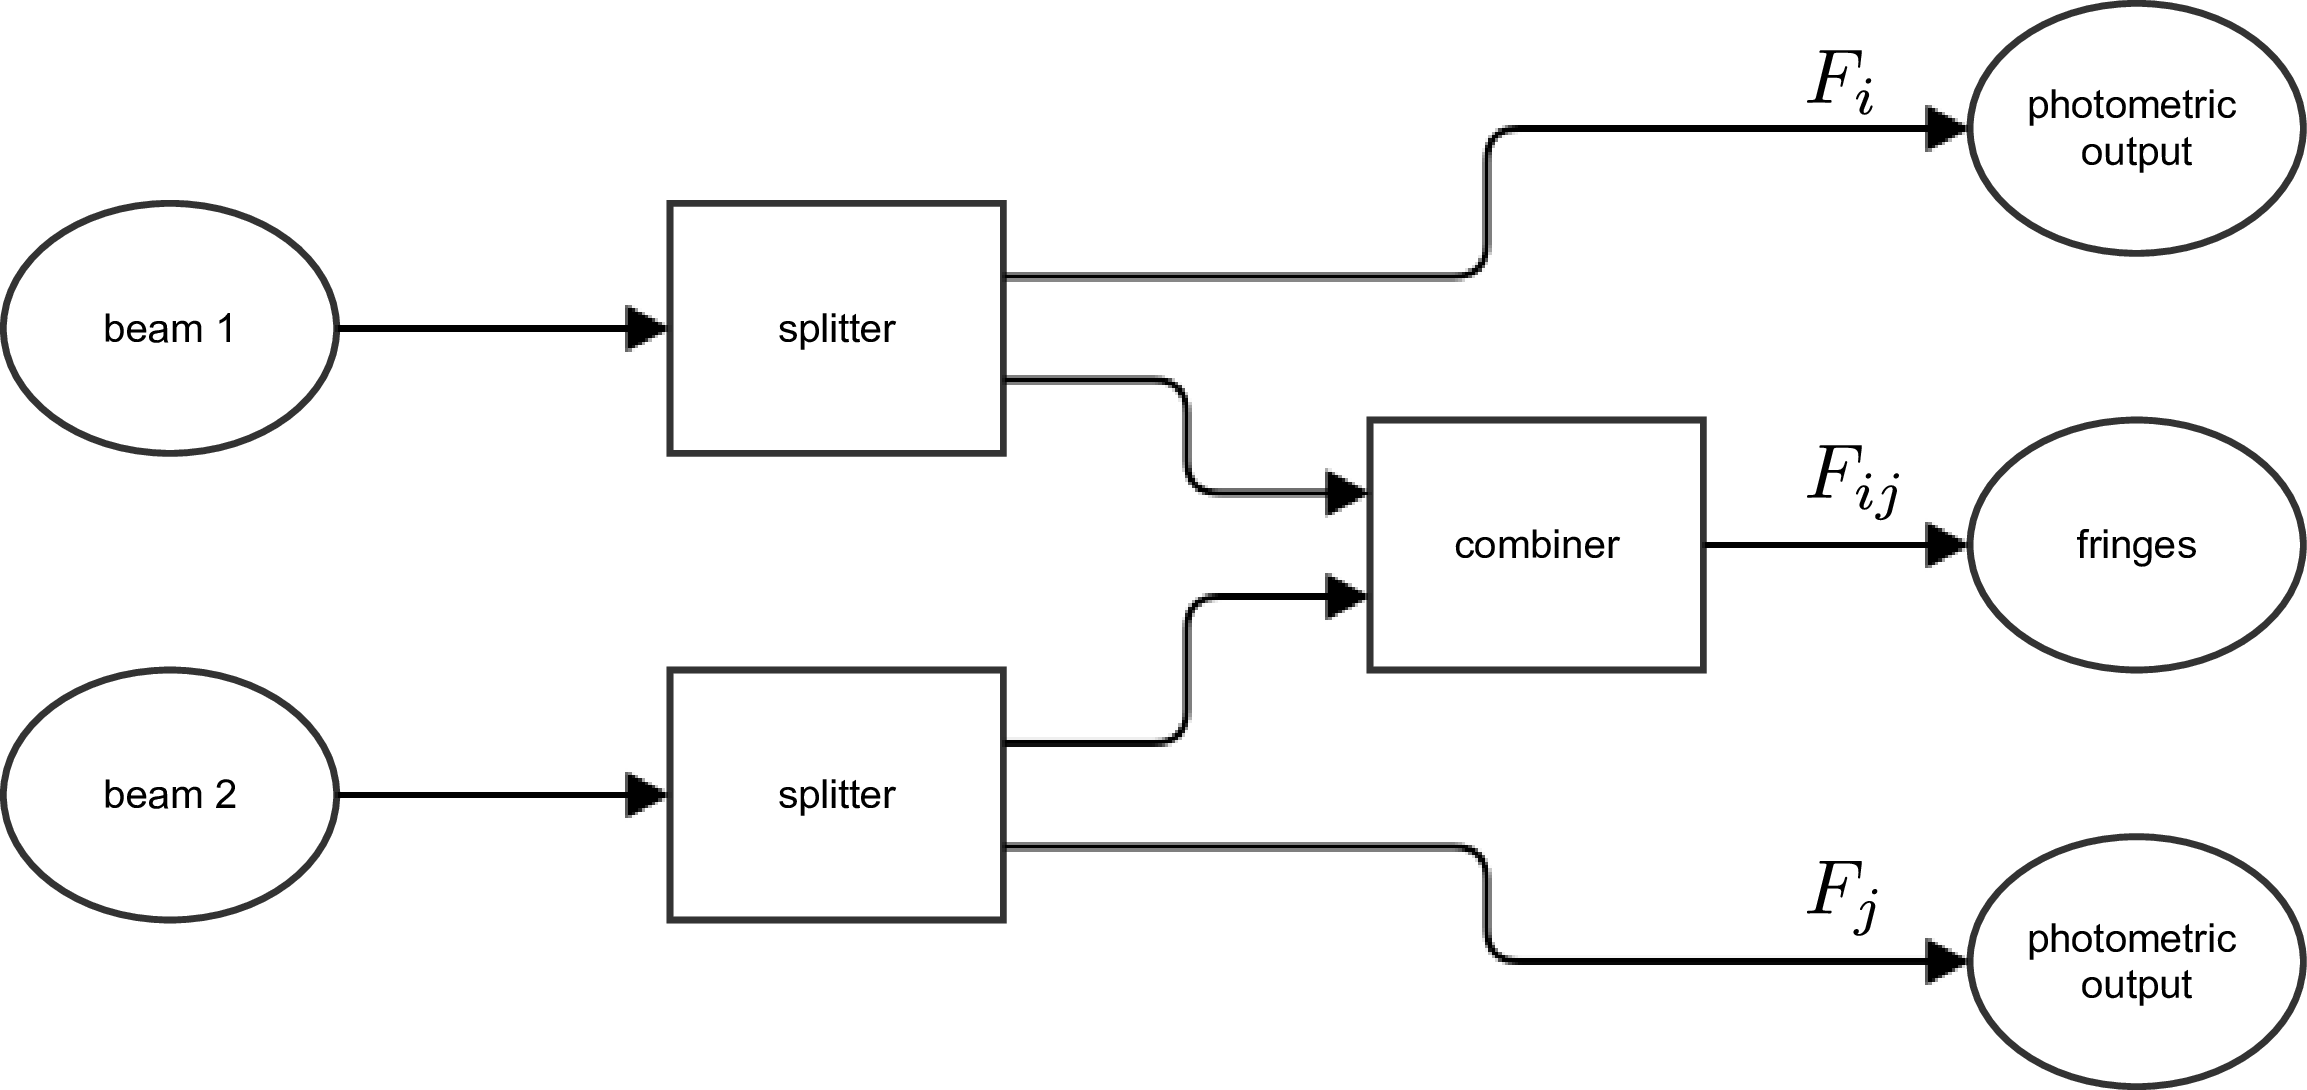 |
Figure 8.8: Schematic of a photometric calibration system SVG file: photometric_calibration.svg
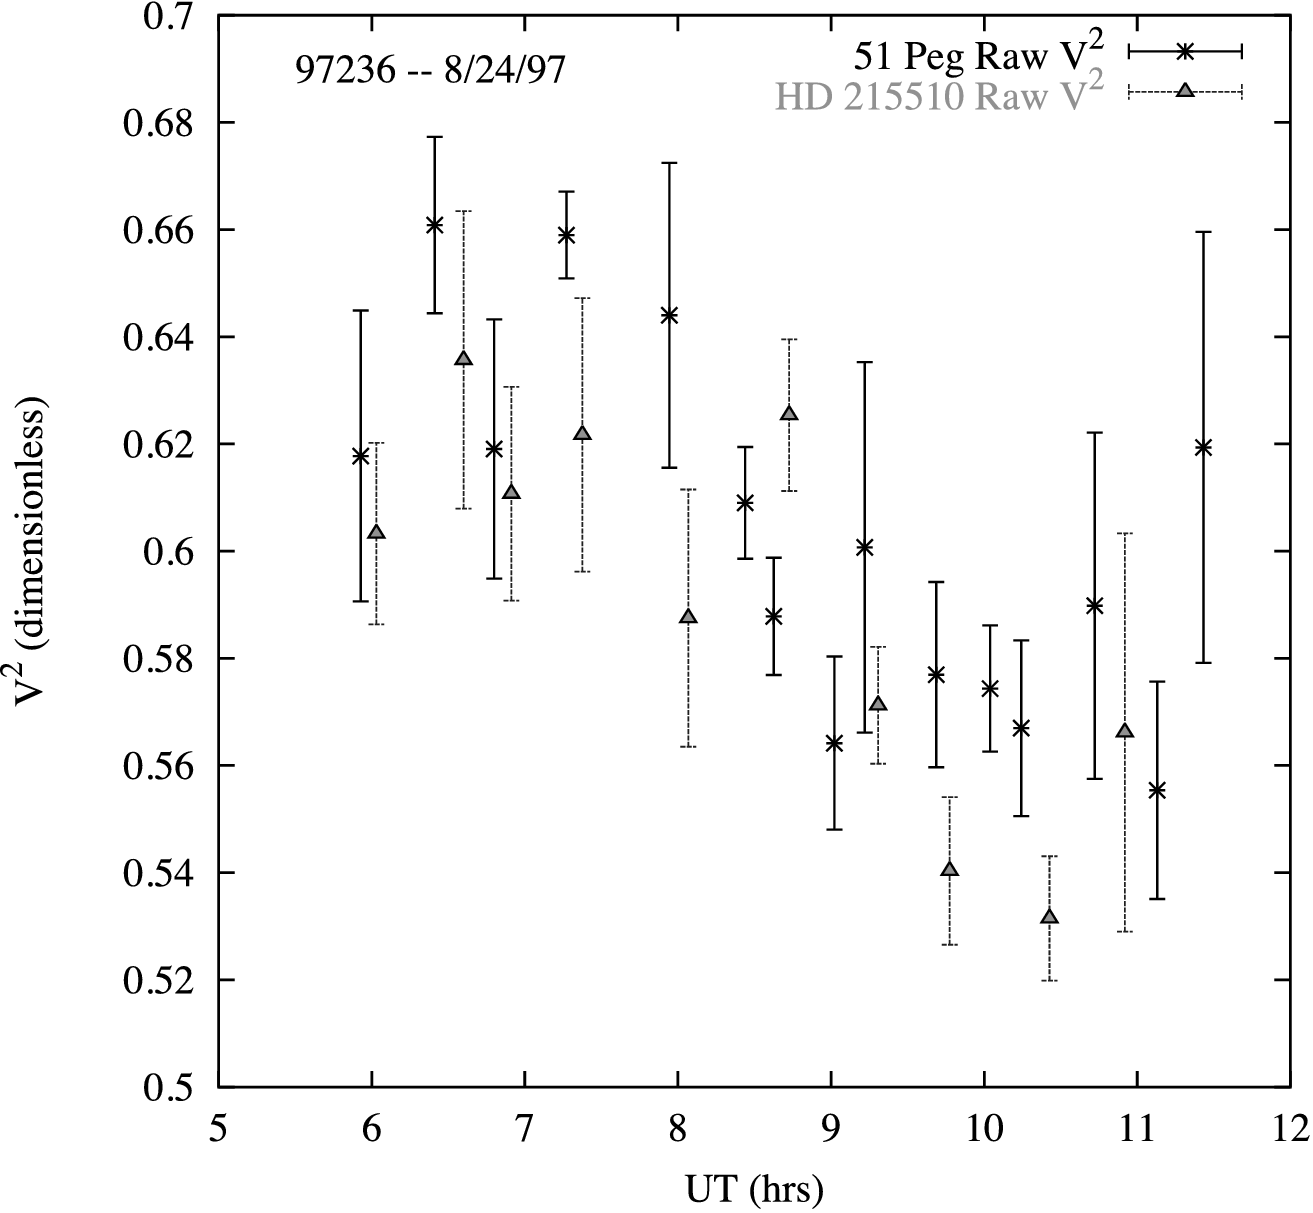 |
Figure 8.9: Squared visibility measurements from the Palomar Testbed Interferometer as a function of time of night. Measurements from both the target star (51 Peg) and the calibrator star (HD 215510) are shown. The authors of the paper conclude that there is little evidence for the target star being resolved, and so the majority of the visibility variation seen in both the target and the calibrator is due to variations in the system visibility. From SVG file: pti-visibilities-vector.svg
.
Chapter 10 Fourier transforms
Chapter 11
Supplementary online material
File translated from TEX by TTH, version 4.05.
On 10 Jul 2015, 13:07.
